You are working on a conservation farm with an endangered species of antelope in central Colorado....
You are working on a conservation farm with an endangered species of antelope in central Colorado. You notice that birth weight of offspring seems to correlate with air temperature, but that the relationship is not as strong in females as in males. You wonder why that could be.
a) What is your testable hypothesis?
b) Design an experiment to test that hypothesis.
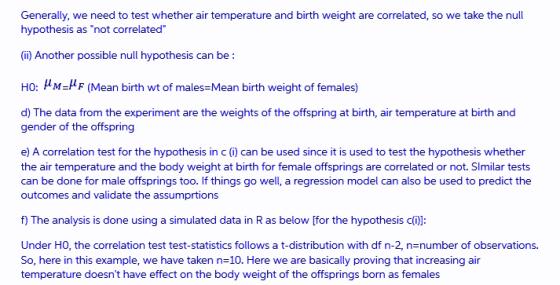
c) What is your null hypothesis?
d) Describe the type of data you will get from the experiment.
e) What type of statistical analysis will you do, and why is it appropriate?
f) Make up some data – at least 10 total. Run your test and show your calculations.
g) What do your results tell you about your hypothesis?
Homework Answers


Add Answer to:
You are working on a conservation farm with an endangered
species of antelope in central Colorado....
As precipitation declines in California, there is less colonization by fungus on conifer seedlings. You wonder...
As precipitation declines in California, there is less colonization by fungus on conifer seedlings. You wonder what that trend will have on future forest health. a ) What is your testable hypothesis? b) Design an experiment to test that hypothesis. c) What is your null hypothesis? d) Describe the type of data you will get from the experiment. e) What type of statistical analysis will you do, and why is it appropriate? Use a different test than question #1....
Name- Exercise 1. A conservation biologist is in charge of the recovery of an endangered species...
 Name- Exercise 1. A conservation biologist is in charge of the recovery of an endangered species called the Giant Kangaroo Rat (GKR), depicted below. The GKR lives in arid grasslands in California and is endangered because most of its range has been developed into agriculture One of the issues threatening the remaining populations is that the kangaroo rats are becoming infected with ear mites that interfere with their hearing ability, which affects mating and survival. The biologist goes to three...
During the course of her study, a researcher couldn’t help but wonder if adult males in...
During the course of her study, a researcher couldn’t help but wonder if adult males in the United States had significantly higher blood sugar levels than adult females. To address this question, the researcher randomly measured fasting blood sugar levels of 20 adult males and 22 adult females. The mean blood sugar level for the 20 males was 118 mg/dL with a standard deviation of 24 mg/dL. The mean blood sugar level for the 22 females was 100 mg/dL with...
Genetics questions, i need help! 1) For the Drosophila red/white cross, you crossed red females and...
 Genetics questions, i need help!
1) For the Drosophila red/white cross, you crossed red females and white males (w'w, wy). a) Draw the Punnett Square for this cross (F1). What is the ratio of red females:red males? b) Suppose in the F1 generation, you observed 70 red females and 30 red males. Do a Chi- Square Test to test the hypothesis of the ratio you found in part (a) above. Do you accept or reject the hypothesis? c) Draw the...
Genetics questions, i need help!
1) For the Drosophila red/white cross, you crossed red females and white males (w'w, wy). a) Draw the Punnett Square for this cross (F1). What is the ratio of red females:red males? b) Suppose in the F1 generation, you observed 70 red females and 30 red males. Do a Chi- Square Test to test the hypothesis of the ratio you found in part (a) above. Do you accept or reject the hypothesis? c) Draw the...
The characteristics of low birth weight children dying of sudden infant death syndrome were examined for...
 The characteristics of low birth weight children dying of sudden infant death syndrome were examined for both females and males. The ages at time of death for samples of 11 girls and 16 boys are shown below. Note that in order to enter these data in Stata, you should have one column for age and one for sex. You wil have 27 rows. Females Males 53 56 60 60 78 87 102 46 52 58 59 78 80 81 84...
Suppose you are interested in whether or not there are differences between males and females in...
 Suppose you are interested in whether or not there are
differences between males and females in time spent per day talking
on the phone. You hypothesize that females spend more time per day
(in minutes) talking on the phone than males. After you entered
your data, you performed descriptive statistics.
Based on the output from the descriptive statistics below, what
analysis should you perform to test your hypothesis? Explain why
you chose that test.
1. Suppose you are interested in...
Suppose you are interested in whether or not there are
differences between males and females in time spent per day talking
on the phone. You hypothesize that females spend more time per day
(in minutes) talking on the phone than males. After you entered
your data, you performed descriptive statistics.
Based on the output from the descriptive statistics below, what
analysis should you perform to test your hypothesis? Explain why
you chose that test.
1. Suppose you are interested in...
(2points) You are studying a species of alga. Haploid cells have 17 chromosomes. Is this surprising...
 (2points) You are studying a species of alga. Haploid cells have 17 chromosomes. Is this surprising that this is an odd number? Why or why not? (2points) You are studying a species of single-celled yeast. For a group of cells that you are studying, you notice that during mitosis, some cells have 5 groups of chromosomes on the metaphase plate and others have 10 groups of chromosomes. What do you think is going on? 2. You are studying a species...
0 25. Time (minutes) 10 35 Activity 2 1. Using any guidelines provided by your teacher, develop a testable question...
 0 25. Time (minutes) 10 35 Activity 2 1. Using any guidelines provided by your teacher, develop a testable question about yeast fermentation. 2. Design an experiment to test your question. Consider the following as you frame your experiment: Question -What are you testing in your experiment? What are you trying to find out? Hypothesis-What do you think will happen? Why do you think so? What do you already know that helps support your hypothesis? Materials -What materials, tools, or...
3. The data set lowbwt.csv contains information for a sample of 100 low birth weight infants born...
3. The data set lowbwt.csv contains information for a sample of 100 low birth weight infants born in two teaching hospitals in Boston, Massachusetts. Measurements of systolic blood pressure are saved under the variable name sbp and indicators of gender – with 1 representing a male and 0 a female – under the name sex. Answer the following questions using SAS. Please provide your SAS code and relevant SAS output. a. Construct a histogram of systolic blood pressure measurements for...
0 25. Time (minutes) 10 35 Activity 2 1. Using any guidelines provided by your teacher,...
 0 25. Time (minutes) 10 35 Activity 2 1. Using any guidelines provided by your teacher, develop a testable question about yeast fermentation. 2. Design an experiment to test your question. Consider the following as you frame your experiment: Question -What are you testing in your experiment? What are you trying to find out? Hypothesis-What do you think will happen? Why do you think so? What do you already know that helps support your hypothesis? Materials -What materials, tools, or...
 Name- Exercise 1. A conservation biologist is in charge of the recovery of an endangered species called the Giant Kangaroo Rat (GKR), depicted below. The GKR lives in arid grasslands in California and is endangered because most of its range has been developed into agriculture One of the issues threatening the remaining populations is that the kangaroo rats are becoming infected with ear mites that interfere with their hearing ability, which affects mating and survival. The biologist goes to three...
 Genetics questions, i need help!
1) For the Drosophila red/white cross, you crossed red females and white males (w'w, wy). a) Draw the Punnett Square for this cross (F1). What is the ratio of red females:red males? b) Suppose in the F1 generation, you observed 70 red females and 30 red males. Do a Chi- Square Test to test the hypothesis of the ratio you found in part (a) above. Do you accept or reject the hypothesis? c) Draw the...
Genetics questions, i need help!
1) For the Drosophila red/white cross, you crossed red females and white males (w'w, wy). a) Draw the Punnett Square for this cross (F1). What is the ratio of red females:red males? b) Suppose in the F1 generation, you observed 70 red females and 30 red males. Do a Chi- Square Test to test the hypothesis of the ratio you found in part (a) above. Do you accept or reject the hypothesis? c) Draw the...
 The characteristics of low birth weight children dying of sudden infant death syndrome were examined for both females and males. The ages at time of death for samples of 11 girls and 16 boys are shown below. Note that in order to enter these data in Stata, you should have one column for age and one for sex. You wil have 27 rows. Females Males 53 56 60 60 78 87 102 46 52 58 59 78 80 81 84...
 Suppose you are interested in whether or not there are
differences between males and females in time spent per day talking
on the phone. You hypothesize that females spend more time per day
(in minutes) talking on the phone than males. After you entered
your data, you performed descriptive statistics.
Based on the output from the descriptive statistics below, what
analysis should you perform to test your hypothesis? Explain why
you chose that test.
1. Suppose you are interested in...
Suppose you are interested in whether or not there are
differences between males and females in time spent per day talking
on the phone. You hypothesize that females spend more time per day
(in minutes) talking on the phone than males. After you entered
your data, you performed descriptive statistics.
Based on the output from the descriptive statistics below, what
analysis should you perform to test your hypothesis? Explain why
you chose that test.
1. Suppose you are interested in...
 (2points) You are studying a species of alga. Haploid cells have 17 chromosomes. Is this surprising that this is an odd number? Why or why not? (2points) You are studying a species of single-celled yeast. For a group of cells that you are studying, you notice that during mitosis, some cells have 5 groups of chromosomes on the metaphase plate and others have 10 groups of chromosomes. What do you think is going on? 2. You are studying a species...
 0 25. Time (minutes) 10 35 Activity 2 1. Using any guidelines provided by your teacher, develop a testable question about yeast fermentation. 2. Design an experiment to test your question. Consider the following as you frame your experiment: Question -What are you testing in your experiment? What are you trying to find out? Hypothesis-What do you think will happen? Why do you think so? What do you already know that helps support your hypothesis? Materials -What materials, tools, or...
 0 25. Time (minutes) 10 35 Activity 2 1. Using any guidelines provided by your teacher, develop a testable question about yeast fermentation. 2. Design an experiment to test your question. Consider the following as you frame your experiment: Question -What are you testing in your experiment? What are you trying to find out? Hypothesis-What do you think will happen? Why do you think so? What do you already know that helps support your hypothesis? Materials -What materials, tools, or...
Most questions answered within 3 hours.
-
Where is the error in this code sequence?
String s1 = "Hello";
String s2 = "ello";...
asked 10 months ago -
Financial data for Joel de Paris, Inc., for last year
follow:
Joel de Paris, Inc.
Balance...
asked 10 months ago -
Consider this reaction:
Al2(SO4)3 (aq)+ BaCl3
(aq) Al2Cl6 (aq)- +
3BaSO4(s) . What is the...
asked 10 months ago -
Suppose that Savneet is considering increasing her
recent random sample from 20 car rentals to 40...
asked 10 months ago -
Trucks arrive at an unloading terminal at an average rate of 120
per hour.
Trucks arrive...
asked 10 months ago -
Why are methanol and ethanol completely soluble in water while
octanol is not very little soluble....
asked 10 months ago -
A facilities manager at a university reads in a research report
that the mean amount of...
asked 10 months ago -
When the CuSO4 is rehydrated by adding water to the anhydrous
compound, is this an endothermic...
asked 10 months ago -
A ray of sunlight is passing from diamond into crown glass; the
angle of incidence is...
asked 10 months ago -
A block of mass 0.249 kg is placed on top of a light, vertical
spring of...
asked 10 months ago -
how do the kidneys compensate in the presences of acidosis
a) trigger hyperventilate
b) reserve acid...
asked 10 months ago -
Question 501 pts
The rental rate of capital to the firm increases. Which of the
following...
asked 10 months ago