
Homework Answers

Add Answer to:
For the given input function below (5) Sketch the phase spectra x(t) 6 -5 -4-3 2...
6.(20%) Given a filter with frequency response function 5 F[h(t)=H=4+j(2f) 3 and given an input x(t)...
 6.(20%) Given a filter with frequency response function 5 F[h(t)=H=4+j(2f) 3 and given an input x(t) eu(t) with its Fourier transform by 1 = *U)-3+ j(27f) F[x()] (10%) (a) Obtain the energy spectral density G,(f) for the input signal x(t) (10%) (b) Obtain the energy spectral density G.(f) for the output signal y(t)
6.(20%) Given a filter with frequency response function 5 F[h(t)=H=4+j(2f) 3 and given an input x(t) eu(t) with its Fourier transform by 1 = *U)-3+ j(27f) F[x()]...
6.(20%) Given a filter with frequency response function 5 F[h(t)=H=4+j(2f) 3 and given an input x(t) eu(t) with its Fourier transform by 1 = *U)-3+ j(27f) F[x()] (10%) (a) Obtain the energy spectral density G,(f) for the input signal x(t) (10%) (b) Obtain the energy spectral density G.(f) for the output signal y(t)
6.(20%) Given a filter with frequency response function 5 F[h(t)=H=4+j(2f) 3 and given an input x(t) eu(t) with its Fourier transform by 1 = *U)-3+ j(27f) F[x()]...
Question #5: Consider the continuous-time signal shown below. x(t) -6 -4 -2 4 -2 (a) Sketch...
 Question #5: Consider the continuous-time signal shown below. x(t) -6 -4 -2 4 -2 (a) Sketch y(t) x1) (b) Sketch y(t) 2x[t- 2) (c) Sketch y(t) - 5x(t/3) (d) Sketch y(t) x(t) -x(-t)
The exponential Fourier series of a certain function is given as x(t) = (2+jl)e"]3+ + j3e-ft...
 The exponential Fourier series of a certain function is given as x(t) = (2+jl)e"]3+ + j3e-ft + 5 - Belt + (2-j1)e131 a) Sketch the exponential Fourier spectra b) By inspection of the spectra in part (a), sketch the trigonometric Fourier spectra for x(t). c) Find the compact trigonometric Fourier series from the spectra in part b.
1. Suppose x(t) -3u(t+3) - u(t)+ 3H(t-3) - 5H(t-6) a. Sketch x(t). b. For the signal x(t) given, ...
 I need a Matlab code example plz
1. Suppose x(t) -3u(t+3) - u(t)+ 3H(t-3) - 5H(t-6) a. Sketch x(t). b. For the signal x(t) given, determine and sketch the following signals: ,g(t) x(t-6) g2(t) - x(3t-6) ii. s(t) x(3t-6) +2 c. Create a MATLAB script that uses a function to express x(t), and plots x(t) in the time interval- 5 < t < 8s, using a time increment of At= 0.01s. Next, use the function to graph each of the...
I need a Matlab code example plz
1. Suppose x(t) -3u(t+3) - u(t)+ 3H(t-3) - 5H(t-6) a. Sketch x(t). b. For the signal x(t) given, determine and sketch the following signals: ,g(t) x(t-6) g2(t) - x(3t-6) ii. s(t) x(3t-6) +2 c. Create a MATLAB script that uses a function to express x(t), and plots x(t) in the time interval- 5 < t < 8s, using a time increment of At= 0.01s. Next, use the function to graph each of the...
Sketch the profile of the wave (x,t) = A sin(kx-t+), where the initial phase is given...
 Sketch the profile of the wave (x,t) = A sin(kx-t+), where
the initial phase is given by each of the following: =0 , =/2
and
3. (20 points) Sketch the profile of the wave P(x,t) = A sin(kx-ot+E), where the initial phase is given by each of the following: E=0, E=1/2 and <=n.
Sketch the profile of the wave (x,t) = A sin(kx-t+), where
the initial phase is given by each of the following: =0 , =/2
and
3. (20 points) Sketch the profile of the wave P(x,t) = A sin(kx-ot+E), where the initial phase is given by each of the following: E=0, E=1/2 and <=n.
Sketch the signals with the figure given below. i. x(t+1)y(t-2) ii. x(4-t)y(2t) X(t) 1 2 3...
 Sketch the signals with the figure given below.
i. x(t+1)y(t-2)
ii. x(4-t)y(2t)
X(t) 1 2 3 t -1 y(t) -2 -1 1 2 -1
Sketch the signals with the figure given below.
i. x(t+1)y(t-2)
ii. x(4-t)y(2t)
X(t) 1 2 3 t -1 y(t) -2 -1 1 2 -1
The given input signal for 2.7.2 is: x(t) = 3 cos(2 π t) + 6 sin(5 π t). Plz explain ...
 The given input signal for 2.7.2 is: x(t) = 3 cos(2
π t) + 6 sin(5 π t).Plz explain steps.Given a causal LTI system described by the differential equation find \(H(s),\) the \(\mathrm{ROC}\) of \(H(s),\) and the impulse response \(h(t)\) of the system. Classify the system as stable/unstable. List the poles of \(H(s) .\) You should the Matlab residue command for this problem.(a) \(y^{\prime \prime \prime}+3 y^{\prime \prime}+2 y^{\prime}=x^{\prime \prime}+6 x^{\prime}+6 x\)2.7.2 The signal \(x(t)\) in the previous problem is...
The given input signal for 2.7.2 is: x(t) = 3 cos(2
π t) + 6 sin(5 π t).Plz explain steps.Given a causal LTI system described by the differential equation find \(H(s),\) the \(\mathrm{ROC}\) of \(H(s),\) and the impulse response \(h(t)\) of the system. Classify the system as stable/unstable. List the poles of \(H(s) .\) You should the Matlab residue command for this problem.(a) \(y^{\prime \prime \prime}+3 y^{\prime \prime}+2 y^{\prime}=x^{\prime \prime}+6 x^{\prime}+6 x\)2.7.2 The signal \(x(t)\) in the previous problem is...
1. Given the graph of the function f(x) below, find the following fi 6-5-421/4 2 345...
 1. Given the graph of the function f(x) below, find the following fi 6-5-421/4 2 345 6 -2 -6 The domain of f(x):The range of f(x): Interval(s) where f(x) is increasing: . The -intercept(s) of f() The value(s) of z for which f(x) 1 Interval(s) where f(x) is negative: . Is the function f(x) invertible? YES or NO (Circle one) Explain your reasoning: . The portion of the graph from z -1 to x-2 is linear. Find an equation for...
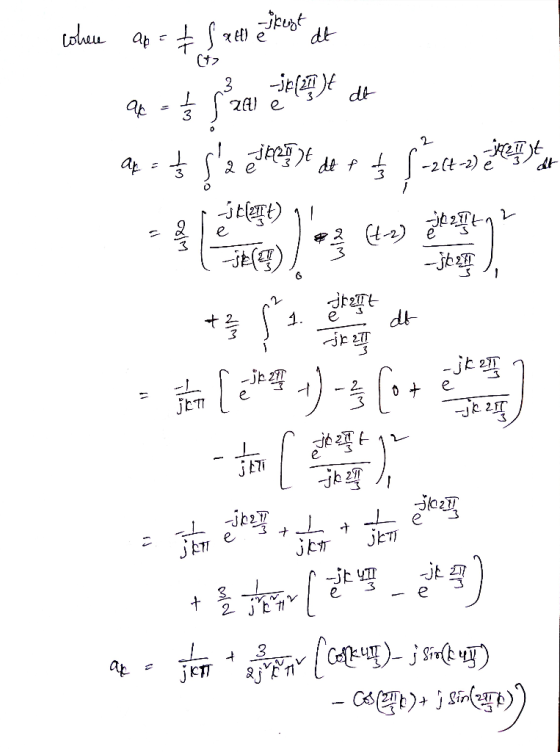
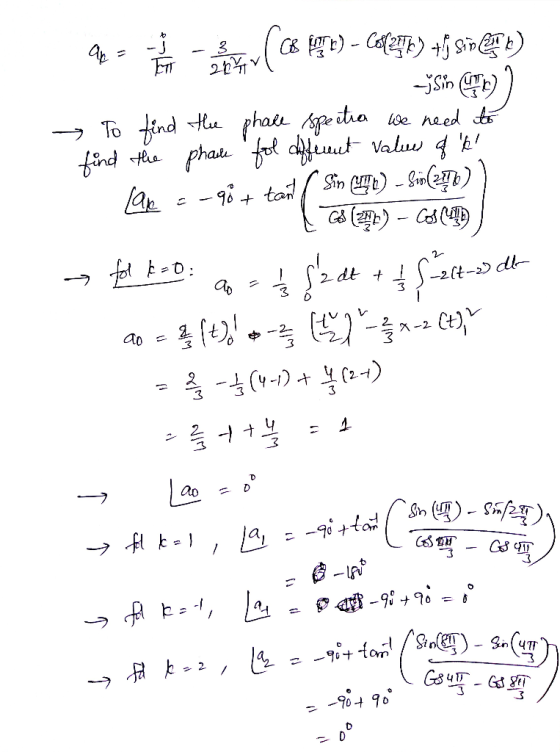
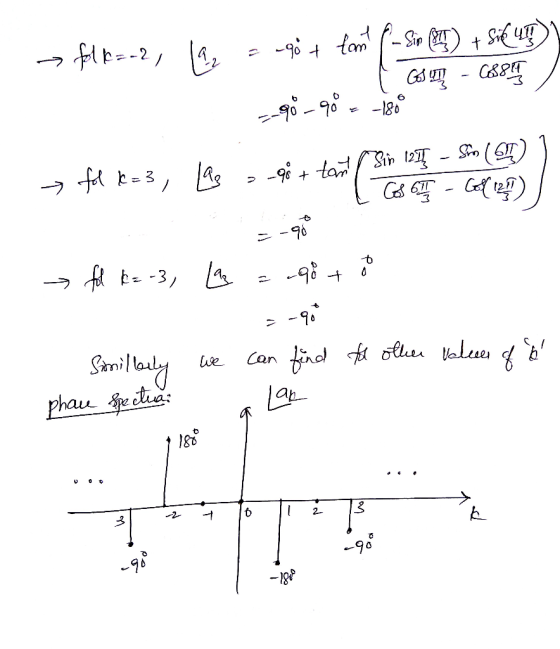
4. A periodic signal x (t) is represented by a trigonometrie Fourier series X(t) = 8...
 4. A periodic signal x (t) is represented by a trigonometrie Fourier series X(t) = 8 + 4 cos (2t + 60°) + 2sin (3t+30°) - cos (4t + 150°) = 0 * +30°) - cos (4t+150°) = 3 +4 Cos(216)+2 Cart ( 6) Col413 (a) Sketch the trigonometric Fourier series spectra (both magnitude and phase). O i 2 3 (b) Sketch the exponential Fourier series spectra (both magnitude and phase). + Dol -3 -2 -1 0 1 2 3...
Q1 Given, f(x) = x + 1, 2 5 x < 4 4,0<x<2 (a) Sketch the...
 Q1 Given, f(x) = x + 1, 2 5 x < 4 4,0<x<2 (a) Sketch the graph of f(x) and its even half-range expansion. Then sketch THREE (3) full periods of the periodic function in the interval -12 < x < 12. (6 marks) (6) Determine the Fourier cosine coefficients of Q1(a). (10 marks) (c) Write out f(x) in terms of Fourier coefficients you have found in Q1(b). (4 marks)
 6.(20%) Given a filter with frequency response function 5 F[h(t)=H=4+j(2f) 3 and given an input x(t) eu(t) with its Fourier transform by 1 = *U)-3+ j(27f) F[x()] (10%) (a) Obtain the energy spectral density G,(f) for the input signal x(t) (10%) (b) Obtain the energy spectral density G.(f) for the output signal y(t)
6.(20%) Given a filter with frequency response function 5 F[h(t)=H=4+j(2f) 3 and given an input x(t) eu(t) with its Fourier transform by 1 = *U)-3+ j(27f) F[x()]...
6.(20%) Given a filter with frequency response function 5 F[h(t)=H=4+j(2f) 3 and given an input x(t) eu(t) with its Fourier transform by 1 = *U)-3+ j(27f) F[x()] (10%) (a) Obtain the energy spectral density G,(f) for the input signal x(t) (10%) (b) Obtain the energy spectral density G.(f) for the output signal y(t)
6.(20%) Given a filter with frequency response function 5 F[h(t)=H=4+j(2f) 3 and given an input x(t) eu(t) with its Fourier transform by 1 = *U)-3+ j(27f) F[x()]...
 Question #5: Consider the continuous-time signal shown below. x(t) -6 -4 -2 4 -2 (a) Sketch y(t) x1) (b) Sketch y(t) 2x[t- 2) (c) Sketch y(t) - 5x(t/3) (d) Sketch y(t) x(t) -x(-t)
 The exponential Fourier series of a certain function is given as x(t) = (2+jl)e"]3+ + j3e-ft + 5 - Belt + (2-j1)e131 a) Sketch the exponential Fourier spectra b) By inspection of the spectra in part (a), sketch the trigonometric Fourier spectra for x(t). c) Find the compact trigonometric Fourier series from the spectra in part b.
 I need a Matlab code example plz
1. Suppose x(t) -3u(t+3) - u(t)+ 3H(t-3) - 5H(t-6) a. Sketch x(t). b. For the signal x(t) given, determine and sketch the following signals: ,g(t) x(t-6) g2(t) - x(3t-6) ii. s(t) x(3t-6) +2 c. Create a MATLAB script that uses a function to express x(t), and plots x(t) in the time interval- 5 < t < 8s, using a time increment of At= 0.01s. Next, use the function to graph each of the...
I need a Matlab code example plz
1. Suppose x(t) -3u(t+3) - u(t)+ 3H(t-3) - 5H(t-6) a. Sketch x(t). b. For the signal x(t) given, determine and sketch the following signals: ,g(t) x(t-6) g2(t) - x(3t-6) ii. s(t) x(3t-6) +2 c. Create a MATLAB script that uses a function to express x(t), and plots x(t) in the time interval- 5 < t < 8s, using a time increment of At= 0.01s. Next, use the function to graph each of the...
 Sketch the profile of the wave (x,t) = A sin(kx-t+), where
the initial phase is given by each of the following: =0 , =/2
and
3. (20 points) Sketch the profile of the wave P(x,t) = A sin(kx-ot+E), where the initial phase is given by each of the following: E=0, E=1/2 and <=n.
Sketch the profile of the wave (x,t) = A sin(kx-t+), where
the initial phase is given by each of the following: =0 , =/2
and
3. (20 points) Sketch the profile of the wave P(x,t) = A sin(kx-ot+E), where the initial phase is given by each of the following: E=0, E=1/2 and <=n.
 Sketch the signals with the figure given below.
i. x(t+1)y(t-2)
ii. x(4-t)y(2t)
X(t) 1 2 3 t -1 y(t) -2 -1 1 2 -1
Sketch the signals with the figure given below.
i. x(t+1)y(t-2)
ii. x(4-t)y(2t)
X(t) 1 2 3 t -1 y(t) -2 -1 1 2 -1
 The given input signal for 2.7.2 is: x(t) = 3 cos(2
π t) + 6 sin(5 π t).Plz explain steps.Given a causal LTI system described by the differential equation find \(H(s),\) the \(\mathrm{ROC}\) of \(H(s),\) and the impulse response \(h(t)\) of the system. Classify the system as stable/unstable. List the poles of \(H(s) .\) You should the Matlab residue command for this problem.(a) \(y^{\prime \prime \prime}+3 y^{\prime \prime}+2 y^{\prime}=x^{\prime \prime}+6 x^{\prime}+6 x\)2.7.2 The signal \(x(t)\) in the previous problem is...
The given input signal for 2.7.2 is: x(t) = 3 cos(2
π t) + 6 sin(5 π t).Plz explain steps.Given a causal LTI system described by the differential equation find \(H(s),\) the \(\mathrm{ROC}\) of \(H(s),\) and the impulse response \(h(t)\) of the system. Classify the system as stable/unstable. List the poles of \(H(s) .\) You should the Matlab residue command for this problem.(a) \(y^{\prime \prime \prime}+3 y^{\prime \prime}+2 y^{\prime}=x^{\prime \prime}+6 x^{\prime}+6 x\)2.7.2 The signal \(x(t)\) in the previous problem is...
 1. Given the graph of the function f(x) below, find the following fi 6-5-421/4 2 345 6 -2 -6 The domain of f(x):The range of f(x): Interval(s) where f(x) is increasing: . The -intercept(s) of f() The value(s) of z for which f(x) 1 Interval(s) where f(x) is negative: . Is the function f(x) invertible? YES or NO (Circle one) Explain your reasoning: . The portion of the graph from z -1 to x-2 is linear. Find an equation for...
 4. A periodic signal x (t) is represented by a trigonometrie Fourier series X(t) = 8 + 4 cos (2t + 60°) + 2sin (3t+30°) - cos (4t + 150°) = 0 * +30°) - cos (4t+150°) = 3 +4 Cos(216)+2 Cart ( 6) Col413 (a) Sketch the trigonometric Fourier series spectra (both magnitude and phase). O i 2 3 (b) Sketch the exponential Fourier series spectra (both magnitude and phase). + Dol -3 -2 -1 0 1 2 3...
 Q1 Given, f(x) = x + 1, 2 5 x < 4 4,0<x<2 (a) Sketch the graph of f(x) and its even half-range expansion. Then sketch THREE (3) full periods of the periodic function in the interval -12 < x < 12. (6 marks) (6) Determine the Fourier cosine coefficients of Q1(a). (10 marks) (c) Write out f(x) in terms of Fourier coefficients you have found in Q1(b). (4 marks)
Most questions answered within 3 hours.
-
Where is the error in this code sequence?
String s1 = "Hello";
String s2 = "ello";...
asked 10 months ago -
Financial data for Joel de Paris, Inc., for last year
follow:
Joel de Paris, Inc.
Balance...
asked 10 months ago -
Consider this reaction:
Al2(SO4)3 (aq)+ BaCl3
(aq) Al2Cl6 (aq)- +
3BaSO4(s) . What is the...
asked 10 months ago -
Suppose that Savneet is considering increasing her
recent random sample from 20 car rentals to 40...
asked 10 months ago -
Trucks arrive at an unloading terminal at an average rate of 120
per hour.
Trucks arrive...
asked 10 months ago -
Why are methanol and ethanol completely soluble in water while
octanol is not very little soluble....
asked 10 months ago -
A facilities manager at a university reads in a research report
that the mean amount of...
asked 10 months ago -
When the CuSO4 is rehydrated by adding water to the anhydrous
compound, is this an endothermic...
asked 10 months ago -
A ray of sunlight is passing from diamond into crown glass; the
angle of incidence is...
asked 10 months ago -
A block of mass 0.249 kg is placed on top of a light, vertical
spring of...
asked 10 months ago -
how do the kidneys compensate in the presences of acidosis
a) trigger hyperventilate
b) reserve acid...
asked 10 months ago -
Question 501 pts
The rental rate of capital to the firm increases. Which of the
following...
asked 10 months ago