
Homework Answers


Add Answer to:
21. In a study conducted for the State Department of Education, 30% of the teachers who...
QUESTION 1 The normal curve is particularly useful as a model for a. data in which...
QUESTION 1 The normal curve is particularly useful as a model for a. data in which mean and median differ b. many populations of psychological and educational data c. distributions of sample statistics d. both (b) and (c) above QUESTION 2 A distribution has a mean of 60 and a standard deviation of 8. For a score of 72, the equivalent z score a. is +1.5 b. is between 0 and +1.0 c. is + 1.2 d. cannot be determined...
kly salaries of teachers in one state are normally distributed with a mean of $490 and...
 kly salaries of teachers in one state are normally distributed with a mean of $490 and a standard deviation of $45. What is the probability that a randomly selected teacher earns more than $525 a week? A) 0.2823 B) 0217 C) 0.7823 D) 0.1003
A) 78 B) 86 C) 89 D) 88 10. The weekly salaries of teachers in one...
 A) 78 B) 86 C) 89 D) 88 10. The weekly salaries of teachers in one state are normally distributed with a mean of S1100 and a standard deviation of $73. What is the amount of money that separates bottom 8.5% of these teachers? Draw diagram for normal distribution, define the amount of money separating bottom 8.5% of teachers salaries and circle one of the multiple choice answers. (6 points) A) 1020 B) 1000 C) 985 D) 1200
Past records suggest that the mean annual income, Hy, of teachers in state of California is...
 Past records suggest that the mean annual income, Hy, of teachers in state of California is less than or equal to the mean annual income, My, of teachers in Oregon. In a current study, a random sample of 10 teachers from California and an independent random sample of 10 teachers from Oregon have been asked to report their mean annual income. The data obtained are as follows: Annual income in dollars California 43096, 44370, 53093, 52462, 41185,49592,41491, 45798,43632, 48322 Oregon...
dPrint Hide email 1) The incomes in a certain large population of high school teachers has...
 dPrint Hide email 1) The incomes in a certain large population of high school teachers has a mean income μ-$70,000 and standard deviation σ-S6, 000. 50 teachers are selected at random from this population for a survey a) (5 pts) Based on the central limit theorem we would expect the distribution of the sample mean incomes to be approximately b) (5 pts) What is the mean of the sampling distribution of the mean (x )? c) (5 pts) What is...
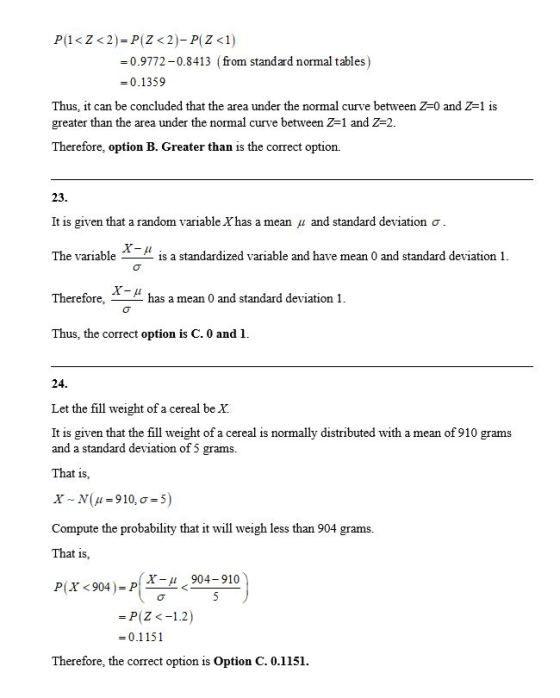
The area under the normal curve between Z = 1 and Z = 2 is ________________...
The area under the normal curve between Z = 1 and Z = 2 is ________________ the area under the normal curve between Z = 0 and Z = 1. A. Less than B. Greater than C. Equal to D. A, B or C above dependent on the value of the mean E. A, B or C above dependent on the value of the standard deviation
An article reported that 5% of married couples in the United States are mixed racially or...
An article reported that 5% of married couples in the United States are mixed racially or ethnically. Consider the population consisting of all married couples in the United States. (a) A random sample of n = 150 couples will be selected from this population and p̂, the proportion of couples that are mixed racially or ethnically, will be computed. What are the mean and standard deviation of the sampling distribution of p̂? (Round your standard deviation to four decimal places.)...
LUUL ULULILICU. 6. Faculty in the Physical Education department at State University consume an average of...
 LUUL ULULILICU. 6. Faculty in the Physical Education department at State University consume an average of 2,000 calories per day with a standard deviation of 250 calories. distribution is normal. What proportion of faculty consumes an amount between 1,600 and 2,400 calories? a. .4452 b. .8904 c. .50 d. None of the above. CHAPTER THREE average weight for women is normally distributed with a mean of pounds and a standard deviation of 15 pounds, then approximately 68% i women should...
The NJ Department of Transportation conducted a study to find the average amount of time car...
The NJ Department of Transportation conducted a study to find the average amount of time car drivers spend commuting during weekends. They surveyed 196 car drivers and the study found out that the driver’s population spent an average of 13 hours commuting with a standard deviation of 11 hours. (a) What is the standard error of the mean? (b) Compute the probability the sample mean is greater than 15 hours? (c) Compute the probability the sample mean is less than...
8.The mean daily production of a herd of cows is assumed to be normally distributed with...
8.The mean daily production of a herd of cows is assumed to be normally distributed with a mean of 39 liters, and standard deviation of 5.6 liters. What is the probability that daily production is between 30.9 and 46.1 liters? (Round your answer to 4 decimal places.) 9.A particular fruit's weights are normally distributed, with a mean of 788 grams and a standard deviation of 36 grams. If you pick one fruit at random, what is the probability that it...
 kly salaries of teachers in one state are normally distributed with a mean of $490 and a standard deviation of $45. What is the probability that a randomly selected teacher earns more than $525 a week? A) 0.2823 B) 0217 C) 0.7823 D) 0.1003
 A) 78 B) 86 C) 89 D) 88 10. The weekly salaries of teachers in one state are normally distributed with a mean of S1100 and a standard deviation of $73. What is the amount of money that separates bottom 8.5% of these teachers? Draw diagram for normal distribution, define the amount of money separating bottom 8.5% of teachers salaries and circle one of the multiple choice answers. (6 points) A) 1020 B) 1000 C) 985 D) 1200
 Past records suggest that the mean annual income, Hy, of teachers in state of California is less than or equal to the mean annual income, My, of teachers in Oregon. In a current study, a random sample of 10 teachers from California and an independent random sample of 10 teachers from Oregon have been asked to report their mean annual income. The data obtained are as follows: Annual income in dollars California 43096, 44370, 53093, 52462, 41185,49592,41491, 45798,43632, 48322 Oregon...
 dPrint Hide email 1) The incomes in a certain large population of high school teachers has a mean income μ-$70,000 and standard deviation σ-S6, 000. 50 teachers are selected at random from this population for a survey a) (5 pts) Based on the central limit theorem we would expect the distribution of the sample mean incomes to be approximately b) (5 pts) What is the mean of the sampling distribution of the mean (x )? c) (5 pts) What is...
 LUUL ULULILICU. 6. Faculty in the Physical Education department at State University consume an average of 2,000 calories per day with a standard deviation of 250 calories. distribution is normal. What proportion of faculty consumes an amount between 1,600 and 2,400 calories? a. .4452 b. .8904 c. .50 d. None of the above. CHAPTER THREE average weight for women is normally distributed with a mean of pounds and a standard deviation of 15 pounds, then approximately 68% i women should...
Most questions answered within 3 hours.
-
Where is the error in this code sequence?
String s1 = "Hello";
String s2 = "ello";...
asked 10 months ago -
Financial data for Joel de Paris, Inc., for last year
follow:
Joel de Paris, Inc.
Balance...
asked 10 months ago -
Consider this reaction:
Al2(SO4)3 (aq)+ BaCl3
(aq) Al2Cl6 (aq)- +
3BaSO4(s) . What is the...
asked 10 months ago -
Suppose that Savneet is considering increasing her
recent random sample from 20 car rentals to 40...
asked 10 months ago -
Trucks arrive at an unloading terminal at an average rate of 120
per hour.
Trucks arrive...
asked 10 months ago -
Why are methanol and ethanol completely soluble in water while
octanol is not very little soluble....
asked 10 months ago -
A facilities manager at a university reads in a research report
that the mean amount of...
asked 10 months ago -
When the CuSO4 is rehydrated by adding water to the anhydrous
compound, is this an endothermic...
asked 10 months ago -
A ray of sunlight is passing from diamond into crown glass; the
angle of incidence is...
asked 10 months ago -
A block of mass 0.249 kg is placed on top of a light, vertical
spring of...
asked 10 months ago -
how do the kidneys compensate in the presences of acidosis
a) trigger hyperventilate
b) reserve acid...
asked 10 months ago -
Question 501 pts
The rental rate of capital to the firm increases. Which of the
following...
asked 10 months ago