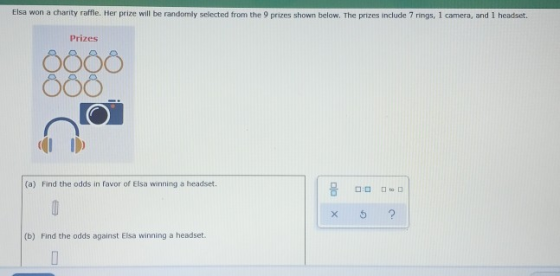
Elsa won a charity raffle. her prize will be randomly selected from the 9 prizes shown in picture. the prizes include 7 rings, 1 camera, and 1 headset.
a) find the odds in favor of Elsa winning a headset.
b) find the odds against Elsa winning a headset.
Homework Answers
Given that,
Elsa won a charity raffle. her prize will be randomly selected from the 9 prizes shown in picture. the prizes include 7 rings, 1 camera, and 1 headset.
a)
We want to find the odds in favor of Elsa winning a headset. Now we know that odds in favor of a particular event are given by number of favorable outcomes to number of unfavorable outcomes.
Formula: Odds in favor of Elsa winning a headset = (Number of favorable outcomes / Number of unfavorable outcomes)
Here favorable outcome is headset and all other outcomes is unfavorable i.e ring and camera is unfavorable outcome.
So, Number of favorable outcomes = 1 [ since there is 1 head set ]
Number of unfavorable outcomes = (9-1) = 8 [ since there is 7 rings and 1 camera ]
So, Odds in favor of Elsa winning a headset = 1/8
Answer:- Odds in favor of Elsa winning a headset = 1/8
b)
We want to find the odds in against of Elsa winning a headset. Now we know that odds against is given by number of unfavorable outcomes to number of favorable outcomes.
Formula: Odds in against of Elsa winning a headset = (Number of unfavorable outcomes / Number of favorable outcomes)
And from the part (a) we get,
Number of favorable outcomes = 1 [ since there is 1 head set ]
Number of unfavorable outcomes = (9-1) = 8 [ since there is 7 rings and 1 camera ]
So, Odds in against of Elsa winning a headset = 8/1
Answer:- Odds in favor of Elsa winning a headset = 8/1
Add Answer to:
Elsa won a charity raffle. her prize will be randomly
selected from the 9 prizes shown...
Michael won a charity rate. His prize will be randomly selected from the prizes shown below....
 Michael won a charity rate. His prize will be randomly selected from the prizes shown below. The prizes include 4 rings, I cara, and headsets O0QO (a) Find the odds in favor of Michael winning a ring. ព្រះឬ E ២ ៤ (b) Find the odds against Michael winning a ring
#58 d 4 members of the Green lected from the group, find ependent or a Green....
 #58
d 4 members of the Green lected from the group, find ependent or a Green. 4 Years High College 4 Years High School (Less than College School Only 4 years) (or More) Total ind the probability of rolling Male than 5. 20 23 82 Female Total 14 15 29 han 4. 45 174 card from a 52-card deck. Source: U.S. Census Bureau Find the probability, expressed as a simplified fraction, thata randomly selected American, age 25 or over 41....
#58
d 4 members of the Green lected from the group, find ependent or a Green. 4 Years High College 4 Years High School (Less than College School Only 4 years) (or More) Total ind the probability of rolling Male than 5. 20 23 82 Female Total 14 15 29 han 4. 45 174 card from a 52-card deck. Source: U.S. Census Bureau Find the probability, expressed as a simplified fraction, thata randomly selected American, age 25 or over 41....
Assume that 12 jurors are randomly selected from a population in which 85% of the people...
 Assume that 12 jurors are randomly selected from a population in which 85% of the people are Mexican- Americans. Refer to the probability distribution table below and find the indicated probabilities. P(x) 0 0+ 1 0+ 2 0+ 3 0+ 4 0.0001 5 0.0006 6 0.004 7 0.0193 8 0.0683 9 0.172 10 0.2924 11 0.3012 12 0.1422 Find the probability of exactly 7 Mexican-Americans among 12 jurors. P(x = 7) = Find the probability of 7 or fewer Mexican-Americans...
т Assume that 12 jurors are randomly selected from a population in which 71% of the...
 т Assume that 12 jurors are randomly selected from a population in which 71% of the people are Mexican- Americans. Refer to the probability distribution table below and find the indicated probabilities P(2) 0 0+ 1 0+ 2 0.0001 3 0.0011 4 0.0063 5 0.0246 6 0.0704 7 0.1477 8 0.2261 9 0.246 10 0.1807 11 0.0804 12 0.0164 Find the probability of exactly 7 Mexican-Americans among 12 jurors. P(x = 7) = Find the probability of 7 or fewer...
1 Assume that 12 jurors are randomly selected from a population in which 87% of the...
 1 Assume that 12 jurors are randomly selected from a population in which 87% of the people are Mexican-Americans. Refer to the probability distribution table below and find the indicated probabilities. P(2) 0 0+ 0+ 2 O+ 3 0+ 4 0+ 5 0.0002 6 0.0019 7 0.0111 8 0.0464 9 0.138 0.2771 11 0.3372 12 0.188 10 Find the probability of exactly 7 Mexican-Americans among 12 jurors. Round your answer to four decimal places P(x = 7) = Find the...
Assume that 12 jurors are randomly selected from a population in which 72% of the people...
Assume that 12 jurors are randomly selected from a population in which 72% of the people are Mexican-Americans. Refer to the probability distribution table below and find the indicated probabilities. x P(x) 0 0+ 1 0+ 2 0.0001 3 0.0009 4 0.005 5 0.0207 6 0.062 7 0.1367 8 0.2197 9 0.2511 10 0.1937 11 0.0906 12 0.0194 Find the probability of exactly 6 Mexican-Americans among 12 jurors. P(x=6)= Find the probability of 6 or fewer Mexican-Americans among 12 jurors....
19 25 The sample of six measurements shown below was randomly selected from a normally distributed...
 19 25 The sample of six measurements shown below was randomly selected from a normally distributed population. Complete parts a through c. 1,2,3,3,4,1 a. Test the null hypothesis that the mean of the population is 3 against the alternative hypothesis. p < 3. Use a = 0.05 Ifq=0.05, find the rejection region for the test. Choose the correct answer below. % 1994 1994 OA. <-2015 or t> 2015 Oct-2571 O E. > 2571 OB < -2015 OD < -2571 ort...
Based on data from a car bumper sticker study, when a car is randomly selected, the...
Based on data from a car bumper sticker study, when a car is randomly selected, the number of bumper stickers and the corresponding probabilities are as shown below. x P(x) 0 0.800 1 0.088 2 0.045 3 0.017 4 0.014 5 0.012 6 0.009 7 0.007 8 0.006 9 0.002 A. Does the given information describe a probability distribution? B. Assuming that a probability distribution is described, find its mean and standard deviation. C. Use the range rule of thumb...
The sample of six measurements shown below was randomly selected from a normally distributed population. Complete...
 The sample of six measurements shown below was randomly selected from a normally distributed population. Complete parts a throughc 1,3, 1, 5, 1,2 a. Test the null hypothesis that the mean of the population is 3 against the alternative hypothesis, 3. Use a 0.10. If a = 0.10, find the rejection region for the test. Choose the correct answer below O A. t 2.015 or t> 2.015 O C. t-2015 O E. t1476 O B. t-1.476 O D. t 1.476...
I NEED IMMEDIATE HELP PLEASE!! What is the answers to these 9 questions! (No) work needs...
 I NEED IMMEDIATE HELP PLEASE!! What is the answers to these 9
questions! (No) work needs to be shown. just the answers please!
Thank you!!
Twenty-five students were surveyed and asked the number of cell phones they have owned in their lifetime. The data is shown below in a (partial) frequency table. What percent of students have owned at least 2 cell phones in their lifetime? Round to the nearest whole number. Data Value Frequency Cumulative Relative Frequency Relative Frequency...
I NEED IMMEDIATE HELP PLEASE!! What is the answers to these 9
questions! (No) work needs to be shown. just the answers please!
Thank you!!
Twenty-five students were surveyed and asked the number of cell phones they have owned in their lifetime. The data is shown below in a (partial) frequency table. What percent of students have owned at least 2 cell phones in their lifetime? Round to the nearest whole number. Data Value Frequency Cumulative Relative Frequency Relative Frequency...
 Michael won a charity rate. His prize will be randomly selected from the prizes shown below. The prizes include 4 rings, I cara, and headsets O0QO (a) Find the odds in favor of Michael winning a ring. ព្រះឬ E ២ ៤ (b) Find the odds against Michael winning a ring
 #58
d 4 members of the Green lected from the group, find ependent or a Green. 4 Years High College 4 Years High School (Less than College School Only 4 years) (or More) Total ind the probability of rolling Male than 5. 20 23 82 Female Total 14 15 29 han 4. 45 174 card from a 52-card deck. Source: U.S. Census Bureau Find the probability, expressed as a simplified fraction, thata randomly selected American, age 25 or over 41....
#58
d 4 members of the Green lected from the group, find ependent or a Green. 4 Years High College 4 Years High School (Less than College School Only 4 years) (or More) Total ind the probability of rolling Male than 5. 20 23 82 Female Total 14 15 29 han 4. 45 174 card from a 52-card deck. Source: U.S. Census Bureau Find the probability, expressed as a simplified fraction, thata randomly selected American, age 25 or over 41....
 Assume that 12 jurors are randomly selected from a population in which 85% of the people are Mexican- Americans. Refer to the probability distribution table below and find the indicated probabilities. P(x) 0 0+ 1 0+ 2 0+ 3 0+ 4 0.0001 5 0.0006 6 0.004 7 0.0193 8 0.0683 9 0.172 10 0.2924 11 0.3012 12 0.1422 Find the probability of exactly 7 Mexican-Americans among 12 jurors. P(x = 7) = Find the probability of 7 or fewer Mexican-Americans...
 т Assume that 12 jurors are randomly selected from a population in which 71% of the people are Mexican- Americans. Refer to the probability distribution table below and find the indicated probabilities P(2) 0 0+ 1 0+ 2 0.0001 3 0.0011 4 0.0063 5 0.0246 6 0.0704 7 0.1477 8 0.2261 9 0.246 10 0.1807 11 0.0804 12 0.0164 Find the probability of exactly 7 Mexican-Americans among 12 jurors. P(x = 7) = Find the probability of 7 or fewer...
 1 Assume that 12 jurors are randomly selected from a population in which 87% of the people are Mexican-Americans. Refer to the probability distribution table below and find the indicated probabilities. P(2) 0 0+ 0+ 2 O+ 3 0+ 4 0+ 5 0.0002 6 0.0019 7 0.0111 8 0.0464 9 0.138 0.2771 11 0.3372 12 0.188 10 Find the probability of exactly 7 Mexican-Americans among 12 jurors. Round your answer to four decimal places P(x = 7) = Find the...
 19 25 The sample of six measurements shown below was randomly selected from a normally distributed population. Complete parts a through c. 1,2,3,3,4,1 a. Test the null hypothesis that the mean of the population is 3 against the alternative hypothesis. p < 3. Use a = 0.05 Ifq=0.05, find the rejection region for the test. Choose the correct answer below. % 1994 1994 OA. <-2015 or t> 2015 Oct-2571 O E. > 2571 OB < -2015 OD < -2571 ort...
 The sample of six measurements shown below was randomly selected from a normally distributed population. Complete parts a throughc 1,3, 1, 5, 1,2 a. Test the null hypothesis that the mean of the population is 3 against the alternative hypothesis, 3. Use a 0.10. If a = 0.10, find the rejection region for the test. Choose the correct answer below O A. t 2.015 or t> 2.015 O C. t-2015 O E. t1476 O B. t-1.476 O D. t 1.476...
 I NEED IMMEDIATE HELP PLEASE!! What is the answers to these 9
questions! (No) work needs to be shown. just the answers please!
Thank you!!
Twenty-five students were surveyed and asked the number of cell phones they have owned in their lifetime. The data is shown below in a (partial) frequency table. What percent of students have owned at least 2 cell phones in their lifetime? Round to the nearest whole number. Data Value Frequency Cumulative Relative Frequency Relative Frequency...
I NEED IMMEDIATE HELP PLEASE!! What is the answers to these 9
questions! (No) work needs to be shown. just the answers please!
Thank you!!
Twenty-five students were surveyed and asked the number of cell phones they have owned in their lifetime. The data is shown below in a (partial) frequency table. What percent of students have owned at least 2 cell phones in their lifetime? Round to the nearest whole number. Data Value Frequency Cumulative Relative Frequency Relative Frequency...
Most questions answered within 3 hours.
-
Where is the error in this code sequence?
String s1 = "Hello";
String s2 = "ello";...
asked 10 months ago -
Financial data for Joel de Paris, Inc., for last year
follow:
Joel de Paris, Inc.
Balance...
asked 10 months ago -
Consider this reaction:
Al2(SO4)3 (aq)+ BaCl3
(aq) Al2Cl6 (aq)- +
3BaSO4(s) . What is the...
asked 10 months ago -
Suppose that Savneet is considering increasing her
recent random sample from 20 car rentals to 40...
asked 10 months ago -
Trucks arrive at an unloading terminal at an average rate of 120
per hour.
Trucks arrive...
asked 10 months ago -
Why are methanol and ethanol completely soluble in water while
octanol is not very little soluble....
asked 10 months ago -
A facilities manager at a university reads in a research report
that the mean amount of...
asked 10 months ago -
When the CuSO4 is rehydrated by adding water to the anhydrous
compound, is this an endothermic...
asked 10 months ago -
A ray of sunlight is passing from diamond into crown glass; the
angle of incidence is...
asked 10 months ago -
A block of mass 0.249 kg is placed on top of a light, vertical
spring of...
asked 10 months ago -
how do the kidneys compensate in the presences of acidosis
a) trigger hyperventilate
b) reserve acid...
asked 10 months ago -
Question 501 pts
The rental rate of capital to the firm increases. Which of the
following...
asked 10 months ago