Question
The number of hours worked per year per adult in a state is
normally distributed with a standard deviation of 37. A sample of
115 adults is selected at random, and the number of hours worked
per year per adult is given below.

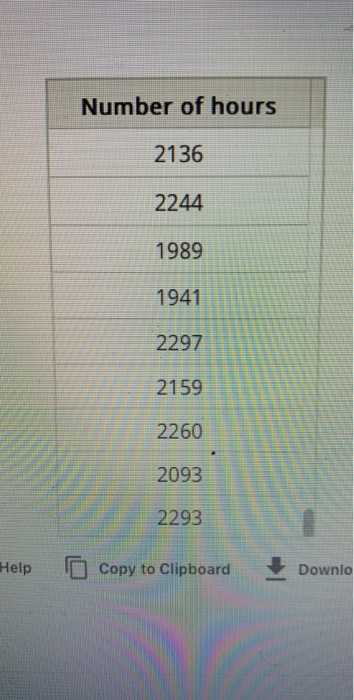
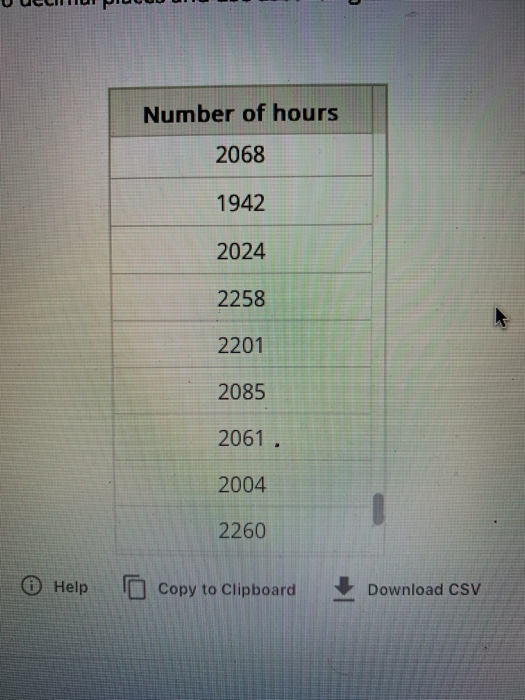
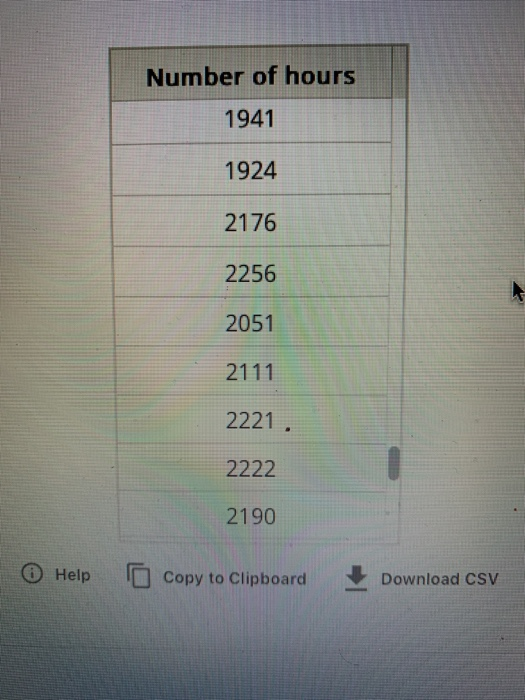
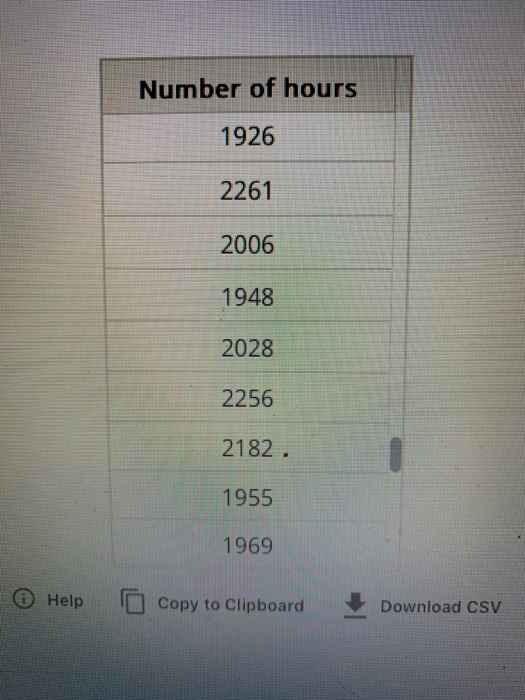

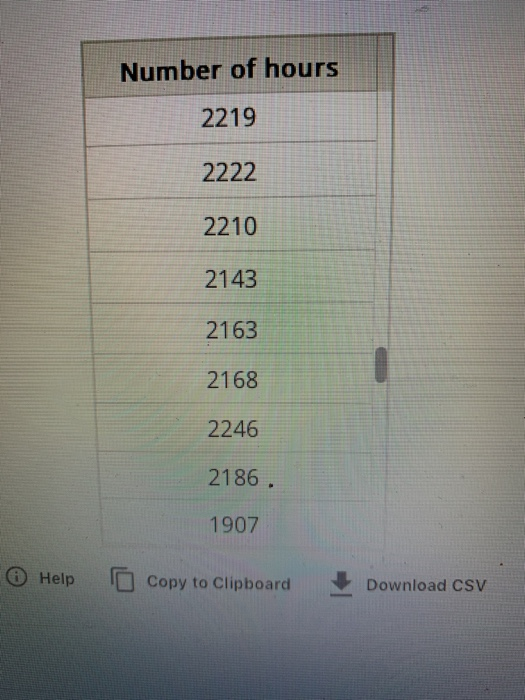
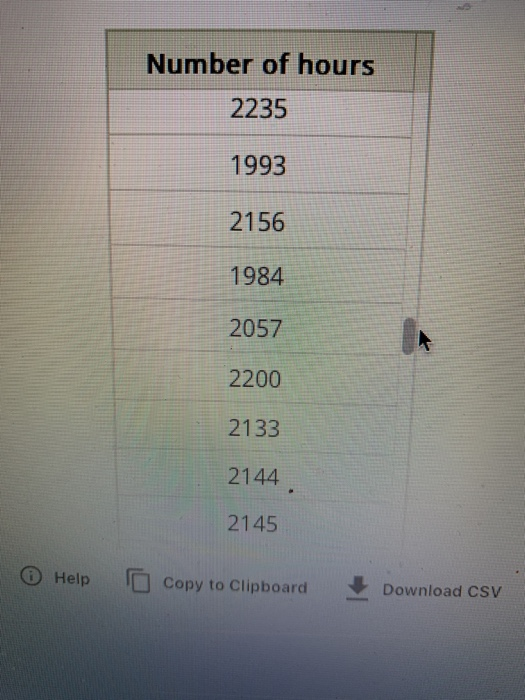


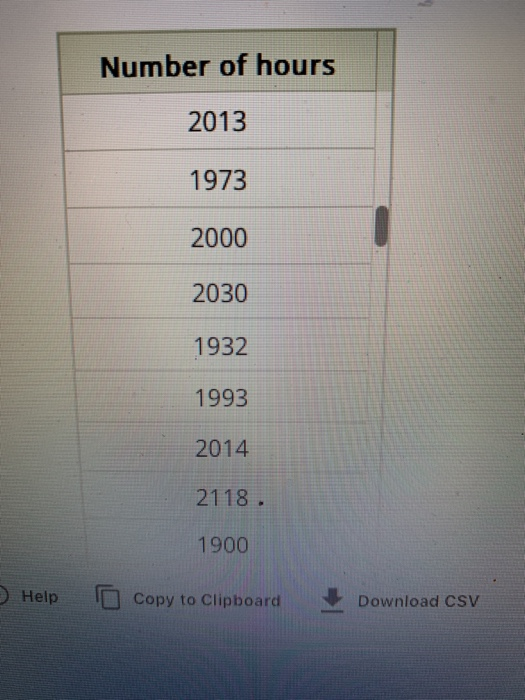
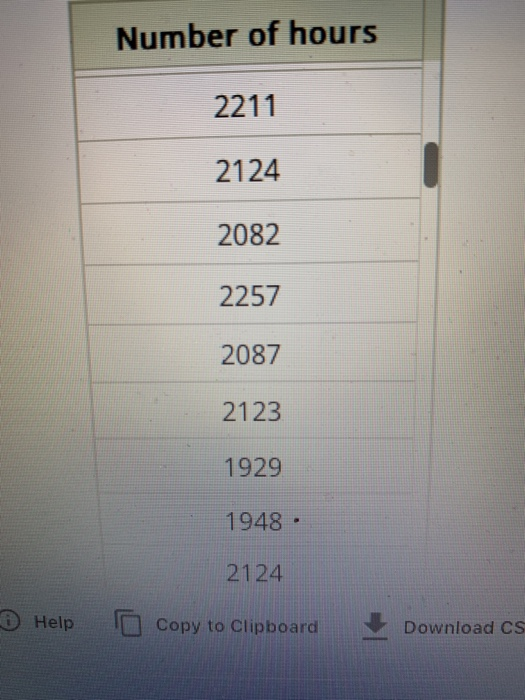
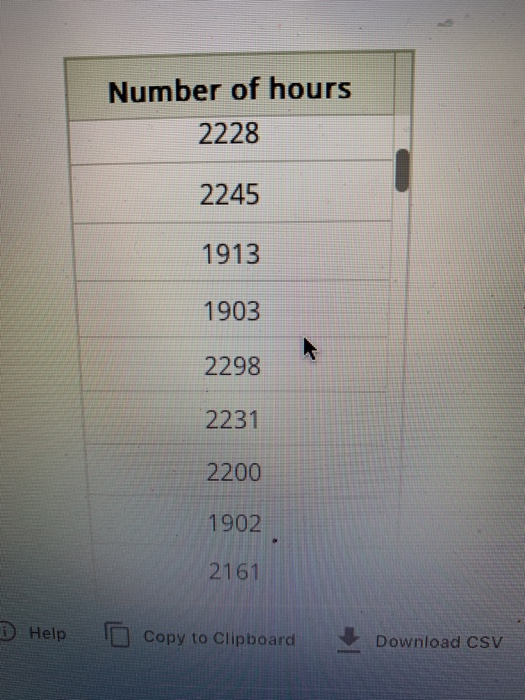
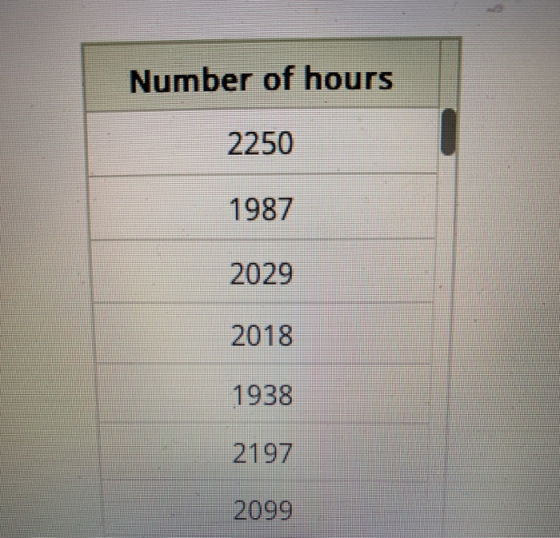
Number of hours
2250
1987
2029
2018
1938
2197
2099
2228
2245
1913
1903
2298
2231
2200
1902
2161
2211
2124
2082
2257
2087
2123
1929
1948
2124
2013
1973
2000
2030
1932
1993
2014
2118
1900
2195
2222
2035
2088
2010
1962
2166
1918
2070
2277
2114
1975
2045
2050
1921
2103
1954
2017
2235
1993
2156
1984
2057
2200
2133
2144
2145
2219
2222
2210
2143
2163
2168
2246
2186
1907
2072
2142
2187
2036
2207
2270
2262
2159
1914
1926
2261
2006
1948
2028
2256
2182
1955
1969
1941
1924
2176
2256
2051
2111
2221
2222
2190
2068
1942
2024
2258
2201
2085
2061
2004
2260
2136
2244
1989
1941
2297
2159
2260
2093
2293
Homework Answers
Answer #1
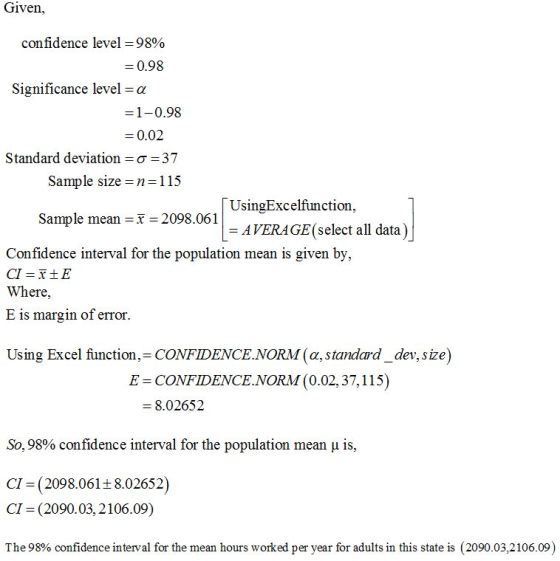
Given, confidence level = 98% = 0.98 Significance level = a =1-0.98 = 0.02 Standard deviation = 0 =37 Sample size =n=115 UsingExcelfunction, Sample mean = š = 2098.061 • 1 = AVERAGE(select all data) Confidence interval for the population mean is given by, CI = JIE Where, E is margin of error. Using Excel function,=CONFIDENCE.NORM (a, standard _dev, size) E=CONFIDENCE.NORM (0.02, 37,115) = 8.02652 So, 98% confidence interval for the population mean u is, CI=(2098.06128.02652) CI = (2090.03, 2106.09) The 98% confidence interval for the mean hours worked per year for adults in this state is (2090.03,2106.09)
Know the answer?
Add Answer to:
The number of hours worked per year per adult in a state is
normally distributed with...
Not the answer you're looking for?
Ask your own homework help question.
Our experts will answer your question WITHIN MINUTES for Free.
Similar Homework Help Questions
Python Pandas, Series and DataFrame Question (NO Loops, No If Statements, No List Comprehensions) The file...
Python Pandas, Series and DataFrame Question (NO Loops, No If Statements, No List Comprehensions) The file bank.csv contains data about bank customers. The last column ('Personal Loan') indicates whether or not the customer was approved for a personal loan or not. Write a function named loan_by_zip that accepts 3 parameters: a file name, a minimum number of records, and a percentage approval rate. The function should return a DataFrame of those zip codes for which we meet the minimum number...
ADVERTISEMENT
Need Online Homework Help?
Ask
a QuestionGet Answers For Free
Most questions answered within 3 hours.
Most questions answered within 3 hours.
ADVERTISEMENT
Active Questions
-
Where is the error in this code sequence?
String s1 = "Hello";
String s2 = "ello";...
asked 11 months ago -
Financial data for Joel de Paris, Inc., for last year
follow:
Joel de Paris, Inc.
Balance...
asked 11 months ago -
Consider this reaction:
Al2(SO4)3 (aq)+ BaCl3
(aq) Al2Cl6 (aq)- +
3BaSO4(s) . What is the...
asked 11 months ago -
Suppose that Savneet is considering increasing her
recent random sample from 20 car rentals to 40...
asked 11 months ago -
Trucks arrive at an unloading terminal at an average rate of 120
per hour.
Trucks arrive...
asked 11 months ago -
Why are methanol and ethanol completely soluble in water while
octanol is not very little soluble....
asked 11 months ago -
A facilities manager at a university reads in a research report
that the mean amount of...
asked 11 months ago -
When the CuSO4 is rehydrated by adding water to the anhydrous
compound, is this an endothermic...
asked 11 months ago -
A ray of sunlight is passing from diamond into crown glass; the
angle of incidence is...
asked 11 months ago -
A block of mass 0.249 kg is placed on top of a light, vertical
spring of...
asked 11 months ago -
how do the kidneys compensate in the presences of acidosis
a) trigger hyperventilate
b) reserve acid...
asked 11 months ago -
Question 501 pts
The rental rate of capital to the firm increases. Which of the
following...
asked 11 months ago
ADVERTISEMENT