A regression between the sales (Y) and the monthly advertising expenditures (X) resulted in the following...
A regression between the sales (Y) and the monthly advertising expenditures (X) resulted in the following predicted regression equations:
= 10.9 + 0.23 x
One observation in the sample data set shows that one store spend $68 K in advertising with sales of $29 K . What is the predicted sales for this store?
|
$ 33 K |
||
|
$26.54 K |
||
|
$17.57 K |
||
|
$29.03 K |
Homework Answers
Here, it is given that
Y =Sales
X = Monthly advertising expenditures
The regression equation is 
If one store spend $68K in advertising with sales of $29K. i.e

The predicted sales for this store is
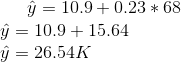
The predicted sales for this store is $26.54 K.
Add Answer to:
A regression between the sales (Y) and the monthly advertising
expenditures (X) resulted in the following...
A regression analysis between sales (Y in $100) and advertising (X in dollars) resulted in the...
A regression analysis between sales (Y in $100) and advertising (X in dollars) resulted in the following equation = 30,000 + 6 X The above equation implies that an a. increase of $1 in advertising is associated with an increase of $600 in sales b. increase of $1 in advertising is associated with an increase of $6 in sales c. increase of $1 in advertising is associated with an increase of $6,000 in sales d. None of the above
Question 14 A regression analysis between sales (Yin $1,000) and advertising (X in dollars) resulted in...
 Question 14 A regression analysis between sales (Yin $1,000) and advertising (X in dollars) resulted in the following equation Y = 30,000+ 4X. The equation implies that an: Increase of $4 in advertising is associated with an increase of $4.000 in sales Increase of $1 in advertising is associated with an increase of $4,000 in sales Increase of $1 in advertising is associated with an increase of $34.000 in sales - Previous Next → No new data to save. Last...
A shoe store developed the following estimated regression equation relating sales to inventory investment and advertising...
A shoe store developed the following estimated regression equation relating sales to inventory investment and advertising expenditures. ŷ = 29 + 12x1 + 7x2 where x1 = inventory investment ($1,000s) x2 = advertising expenditures ($1,000s) y = sales ($1,000s). (a) Predict the sales (in dollars) resulting from a $14,000 investment in inventory and an advertising budget of $11,000. $ A shoe store developed the following estimated regression equation relating sales to inventory investment and advertising expenditures. ŷ = 27 +...
The following is the regression output for fitting the regression model that predicts the monthly sales...
 The following is the regression output for fitting the regression model that predicts the monthly sales of the power bars from the price of the power bar and the monthly budget for the in-store promotional expenditures. Constant Price Promotion Coefficient 6310.55 -50.855 3.5554 95% CI 95% CI Lower Limit Upper Limit 4052.83138 8568.26862 -79.76212 -21.94788 1.72715 5.38365 TP-value 5.89715 2e-05 -3.7117 0.00173 4.10297 0.00074 Use the regresion output above to answer the following questions. Part A What is the predicted...
Number 2 A regression analysis of 62 months’ data relating a company's monthly advertising expenses (x,...
Number 2 A regression analysis of 62 months’ data relating a company's monthly advertising expenses (x, in thousands of dollars) to its sales (y, in thousands of dollars) yields the following output: • ?0=100 • ?1=5.3 • Standard error of the estimate ?=??=56 • Standard error for ?1, ???1=0.3 Furthermore, when ?∗=9, the standard error for a confidence interval for the estimated mean response is given by ???̂=29, while the standard error for a prediction interval is ???̂=63.1. (a) (3...
Regression analysis was applied between sales (Y in $1000) and advertising (X in $10,000), and the...
 Regression analysis was applied
between sales (Y in $1000) and advertising (X in $10,000), and the
following estimated regression equation was obtained
Based on the above estimated regression line if advertising is
$10,000, then the point estimated for sales (in dollars) is
a.503
b. 5030
c. 50,300
d.503,000
Ÿ=500+ 3x
Regression analysis was applied
between sales (Y in $1000) and advertising (X in $10,000), and the
following estimated regression equation was obtained
Based on the above estimated regression line if advertising is
$10,000, then the point estimated for sales (in dollars) is
a.503
b. 5030
c. 50,300
d.503,000
Ÿ=500+ 3x
b Multiple Choice 14-019 A regression analysis between sales u in $tooo) and advertising (x in...
 b Multiple Choice 14-019 A regression analysis between sales u in $tooo) and advertising (x in dollars) resulted in the following equation: Y = 30,000 + 4x The above equation implies that an O a. increase of $1 in advertising is associated with an increase of $4 in sales. O b. increase of $1 in advertising is associated with an increase of $4000 in sales. O c. increase of $4 in advertising is associated with an increase of $4000 in...
Please answer 24 and 26 only A).22 B).08 24) Data were collected on monthly sales revenues...
 Please answer 24 and 26 only
A).22 B).08 24) Data were collected on monthly sales revenues (in $1000s) and monthly advertising expenditures (51005) fora sample of drug sample of drug stores. The regression line relating revenues () to advertising expenditure (X) is estimated to 3+ 9.00x. The correct interpretation of the slope is that for each additional spent on advertising, predicted sales revenue decreases by $9000. be y =-48. A) $100 B) $1 spent on advertising, predicted sales revenue increases...
Please answer 24 and 26 only
A).22 B).08 24) Data were collected on monthly sales revenues (in $1000s) and monthly advertising expenditures (51005) fora sample of drug sample of drug stores. The regression line relating revenues () to advertising expenditure (X) is estimated to 3+ 9.00x. The correct interpretation of the slope is that for each additional spent on advertising, predicted sales revenue decreases by $9000. be y =-48. A) $100 B) $1 spent on advertising, predicted sales revenue increases...
The following estimated regression equation relating sales to inventory investment and advertising expenditures was given. ý...
 The following estimated regression equation relating sales to inventory investment and advertising expenditures was given. ý = 24 + 14x + 7x2 The data used to develop the model came from a survey of 10 stores; for those data, SST = 18,000 and SSR = 12,780. (a) For the estimated regression equation given, compute RS R2 = (b) Compute R, (Round your answer to two decimal places.) (c) Does the model appear to explain a large amount of variability in...
Ten communities roughly comparable in size, wealth, and purchasing powers were selected to investigate the effect of advertising expenditures on sales of electric vehicles. For each community, the ad...
 Ten communities roughly comparable in size, wealth, and purchasing powers were selected to investigate the effect of advertising expenditures on sales of electric vehicles. For each community, the advertising outlay (X, in thousands of dollars) and the sales (Y, in units sold) are shown below: dvertising Expenditure Sales 3.9 7.8 1.1 6.6 3.4 2.5 6.0 32 25 23 30 4.6 25 2.0 1. 2. 3. Find the regression equation for predicting sales from advertising expenditure. Construct the 99 percent confidence...
 Question 14 A regression analysis between sales (Yin $1,000) and advertising (X in dollars) resulted in the following equation Y = 30,000+ 4X. The equation implies that an: Increase of $4 in advertising is associated with an increase of $4.000 in sales Increase of $1 in advertising is associated with an increase of $4,000 in sales Increase of $1 in advertising is associated with an increase of $34.000 in sales - Previous Next → No new data to save. Last...
 The following is the regression output for fitting the regression model that predicts the monthly sales of the power bars from the price of the power bar and the monthly budget for the in-store promotional expenditures. Constant Price Promotion Coefficient 6310.55 -50.855 3.5554 95% CI 95% CI Lower Limit Upper Limit 4052.83138 8568.26862 -79.76212 -21.94788 1.72715 5.38365 TP-value 5.89715 2e-05 -3.7117 0.00173 4.10297 0.00074 Use the regresion output above to answer the following questions. Part A What is the predicted...
 Regression analysis was applied
between sales (Y in $1000) and advertising (X in $10,000), and the
following estimated regression equation was obtained
Based on the above estimated regression line if advertising is
$10,000, then the point estimated for sales (in dollars) is
a.503
b. 5030
c. 50,300
d.503,000
Ÿ=500+ 3x
Regression analysis was applied
between sales (Y in $1000) and advertising (X in $10,000), and the
following estimated regression equation was obtained
Based on the above estimated regression line if advertising is
$10,000, then the point estimated for sales (in dollars) is
a.503
b. 5030
c. 50,300
d.503,000
Ÿ=500+ 3x
 b Multiple Choice 14-019 A regression analysis between sales u in $tooo) and advertising (x in dollars) resulted in the following equation: Y = 30,000 + 4x The above equation implies that an O a. increase of $1 in advertising is associated with an increase of $4 in sales. O b. increase of $1 in advertising is associated with an increase of $4000 in sales. O c. increase of $4 in advertising is associated with an increase of $4000 in...
 Please answer 24 and 26 only
A).22 B).08 24) Data were collected on monthly sales revenues (in $1000s) and monthly advertising expenditures (51005) fora sample of drug sample of drug stores. The regression line relating revenues () to advertising expenditure (X) is estimated to 3+ 9.00x. The correct interpretation of the slope is that for each additional spent on advertising, predicted sales revenue decreases by $9000. be y =-48. A) $100 B) $1 spent on advertising, predicted sales revenue increases...
Please answer 24 and 26 only
A).22 B).08 24) Data were collected on monthly sales revenues (in $1000s) and monthly advertising expenditures (51005) fora sample of drug sample of drug stores. The regression line relating revenues () to advertising expenditure (X) is estimated to 3+ 9.00x. The correct interpretation of the slope is that for each additional spent on advertising, predicted sales revenue decreases by $9000. be y =-48. A) $100 B) $1 spent on advertising, predicted sales revenue increases...
 The following estimated regression equation relating sales to inventory investment and advertising expenditures was given. ý = 24 + 14x + 7x2 The data used to develop the model came from a survey of 10 stores; for those data, SST = 18,000 and SSR = 12,780. (a) For the estimated regression equation given, compute RS R2 = (b) Compute R, (Round your answer to two decimal places.) (c) Does the model appear to explain a large amount of variability in...
 Ten communities roughly comparable in size, wealth, and purchasing powers were selected to investigate the effect of advertising expenditures on sales of electric vehicles. For each community, the advertising outlay (X, in thousands of dollars) and the sales (Y, in units sold) are shown below: dvertising Expenditure Sales 3.9 7.8 1.1 6.6 3.4 2.5 6.0 32 25 23 30 4.6 25 2.0 1. 2. 3. Find the regression equation for predicting sales from advertising expenditure. Construct the 99 percent confidence...
Most questions answered within 3 hours.
-
Where is the error in this code sequence?
String s1 = "Hello";
String s2 = "ello";...
asked 10 months ago -
Financial data for Joel de Paris, Inc., for last year
follow:
Joel de Paris, Inc.
Balance...
asked 10 months ago -
Consider this reaction:
Al2(SO4)3 (aq)+ BaCl3
(aq) Al2Cl6 (aq)- +
3BaSO4(s) . What is the...
asked 10 months ago -
Suppose that Savneet is considering increasing her
recent random sample from 20 car rentals to 40...
asked 10 months ago -
Trucks arrive at an unloading terminal at an average rate of 120
per hour.
Trucks arrive...
asked 10 months ago -
Why are methanol and ethanol completely soluble in water while
octanol is not very little soluble....
asked 10 months ago -
A facilities manager at a university reads in a research report
that the mean amount of...
asked 10 months ago -
When the CuSO4 is rehydrated by adding water to the anhydrous
compound, is this an endothermic...
asked 10 months ago -
A ray of sunlight is passing from diamond into crown glass; the
angle of incidence is...
asked 10 months ago -
A block of mass 0.249 kg is placed on top of a light, vertical
spring of...
asked 10 months ago -
how do the kidneys compensate in the presences of acidosis
a) trigger hyperventilate
b) reserve acid...
asked 10 months ago -
Question 501 pts
The rental rate of capital to the firm increases. Which of the
following...
asked 10 months ago