
Homework Answers
Q1) Price and quantity demand have an inverse relationship, that is, as price increases quantity demanded decreases, cetris paribus
While, Price and quantity supplies have a direct relationship, that is, as price increases quantity supplied increases, cetris paribus
So P=3Q+15 shows a direct relation and ins therefore the supply equation while P=-Q+55 shows an inverse relationship, and is therefore the demand equation
Q2) Equilibrium can be achieved at by equating the two equations:
3Q+15 = -Q+55
=> 4Q = 40
=> Q = 10
So the equilibrium is at a quantity of 10 units and the price will be P = 3 x 10 +15 = $45
Q3)
We need to take a few data points satisfying the two equations:
| Price | QD | QS |
| 36 | 19 | 7 |
| 39 | 16 | 8 |
| 42 | 13 | 9 |
| 45 | 10 | 10 |
| 48 | 7 | 11 |
| 51 | 4 | 12 |
We then plot the graphs:

CS = Consumer surplus, PS = Producer surplus
4) Producer surplus stands for the difference between the price at which the supplier is willing to sell and the price at which he actually sells.
At equilibrium price, he gets $45 per unit while, he would sell 0 units at a price of 15, derived from P = 3(0) +15 so the producer surplus would be 1/2 x Q x (Eqiulibrium price - Price of 0 units)
Producer surplus = 1/2 x 10 x (45-15)
Producer surplus = 1/2 x 10 x (30) = 150
(1) P = 3Q + 15 is the supply equation as the slope is positive (which denotes a positive/direct relationship between price and quantity) and P = -Q+55 is the demand equation since the slope is negative (which denotes a negative/inverse relationship between price and quantity) .
(2) At equilibrium, supply = demand => 3Q + 15 = -Q + 55 => 3Q+Q = 55-15 => 4Q = 40 => Q = 10
Now P = 3Q + 15 = 3(10)+15 = 45
Price can be derived from the demand equation too, i.e., P = -10+55 = 45
Hence, the equilibrium quantity = 10 and equilibrium price = 45
(3) As shown below, the equilibrium quantity = 10 and equilibrium price = 45. And the area of the triangle ABE (grey shaded area) refers to the consumer surplus, which measures the difference between consumers' willingness to pay and they actually pay. On the other hand, the orange share area (triangle BCE) represents the producer surplus which measures the amount the producer actually gets and the cost the producer incurs.
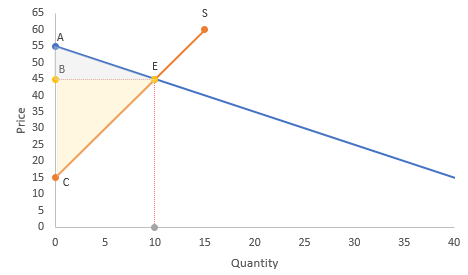
(4) As described in (3), the producer surplus is measured by the area of the triangle BCE. In the present case, producer surplus = 0.5 * BC * BE, where BC is the distance between equilibrium price and intercept of the supply curve, i.e., 45 - 15 = 30 and BE = distance from the origin to the equilibrium output, i.e., BE = 10. Hence, producer surplus = 0.5*30*10 = 150
(5) Social surplus in this case would be the surplus for consumers and surplus for producer. We can calculate consumer surplus by area of triangle ABE = 0.5*AB*BE, where AB = intercept of demand curve - equilibrium price = 55-45 = 10 and BE = 10 as explained in (4). Hence, consumer surplus = 0.5*10*10 = 50.
Hence, total social surplus = producer surplus (calculated in 4) + consumer surplus = 150 + 50 = 200
(6) A decrease in supply can be depicted by a leftward shift of the supply curve, from S to S' as shown in the diagram below.

Several factors can cause such a shift in supply such as low production, political unrest, war etc.
(7) When supply decreases as shown above, a new equilibrium is attained with a higher price and hence quantity demanded decreases as shown in the above diagram.
Add Answer to:
ECON 2012 Homework 4 Due: 3/5 P=3Q+15 and P=-Q+ 55 1. Identify which equation is supply...
Use the following equations to answer the remaining homework questions: Demand: P = 80 – 3Q...
Use the following equations to answer the remaining homework questions: Demand: P = 80 – 3Q Supply: P = 2Q + 20 What is the equilibrium price? What is the equilibrium quantity? What is the consumer surplus? What are total expenditures for consumers? What is producer surplus? What is the total revenue for the producer?
1. Use the following supply and demand equations. Supply: p = 4 + 3q. Demand: p=2,132-9....
 1. Use the following supply and demand equations. Supply: p = 4 + 3q. Demand: p=2,132-9. Use these equations to respond to the following questions. (a) What is the market equilibrium? (4%) (b) Under the market equilibrium, what is Total Surplus? (4%) (c) Suppose the government enacts a price ceiling of p= 2, 000. What is Producer Surplus, Consumer Surplus, Total Surplus, and Deadweight Loss? (4%) (d) Instead, suppose that the government enacts a price ceiling of p = 1,100....
Question 3: Suppose that the demand equation: P- 10-Q and supply equation: P Q a. Calculate...
 Question 3: Suppose that the demand equation: P- 10-Q and supply equation: P Q a. Calculate the equilibrium price and quantity b. Calculate the consumer surplus, producer surplus and total surplus at equilibriunm Suppose the government imposes a tax of $2 for each unit bought. Derive the new equilibrium price that consumers pay, the price that firms receive, and quantity c. d. Calculate the deadweight loss of this tax. e. In a diagram, show the equilibrium in part a and...
Consider the following monthly market demand and supply equation: P=$1,000-Q P=4Q (a) Find the equilibrium level...
Consider the following monthly market demand and supply equation: P=$1,000-Q P=4Q (a) Find the equilibrium level of Q. ( b) Find the equilibrium level of P. (c) What would be the size of consumer surplus (value captured by consumers) and producer surplus (value captured by producers) at the equilibrium price? Show your work and show your answer on a well-labeled graph. (d) Given the current supply and demand, what would be the size of excess supplied (or demanded) when the...
Need help with 3, 4, and 5 Econ 206 Dr. George Problem Set #2 1) Consider...
 Need help with 3, 4, and 5
Econ 206 Dr. George Problem Set #2 1) Consider the market for burritos (like Chipotle) a. Draw a supply and demand graph that shows the equilibrium price equal to $3.50 and the equilibrium quantity equal to 200 per day. Show the area of the graph that b. On the graph, show the effect when the price of pizza falls (assuming that pizza and c. On a new graph, show the effect when the...
Need help with 3, 4, and 5
Econ 206 Dr. George Problem Set #2 1) Consider the market for burritos (like Chipotle) a. Draw a supply and demand graph that shows the equilibrium price equal to $3.50 and the equilibrium quantity equal to 200 per day. Show the area of the graph that b. On the graph, show the effect when the price of pizza falls (assuming that pizza and c. On a new graph, show the effect when the...
Suppose that the market for fine champagne is currently in equilibrium. The demand and supply functions...
Suppose that the market for fine champagne is currently in equilibrium. The demand and supply functions are as follows: QS = (1⁄2) P QD= 12 – (1/4)P a. Calculate the equilibrium quantity and price. Then graph supply and demand and show the equilibrium. b. Suppose that the government is considering a tax of $12 per bottle of champagne. Calculate each of the following: i. The change in equilibrium quantity due to the tax. ii. The change in the price buyers...
Use the following supply and demand equations. Supply:p= 4 + 3q. Demand:p= 2,132−q. Use these equations...
Use the following supply and demand equations. Supply:p= 4 + 3q. Demand:p= 2,132−q. Use these equations to respond to the following questions. (a) What is the market equilibrium? (b) Under the market equilibrium, what is Total Surplus? (c) Suppose the government enacts a price ceiling of ̄p= 2,000. What is ProducerSurplus, Consumer Surplus, Total Surplus, and Deadweight Loss? (d) Instead, suppose that the government enacts a price ceiling of ̄p= 1,100. What is Producer Surplus, Consumer Surplus, Total Surplus, and...
1) Supply and demand P = 0.5QS + 30 P = -0.4QD + 120 a) Given...
1) Supply and demand P = 0.5QS + 30 P = -0.4QD + 120 a) Given the above equations, produce a chart illustrating both the supply and demand schedules in increments of 5 ranging from price = 50 to price = 110. b) Solve for the equilibrium price and quantity and show your work. c) Graph the result, labeling the axes, the supply and demand curves, the equilibrium point, and the price and quantity amounts. Use a proper scale. d)...
Your demand and supply functions are given by D: P=50-Q and S: P=10+3Q. Determine the market...
Your demand and supply functions are given by D: P=50-Q and S: P=10+3Q. Determine the market equilibrium price and quantity. If a price floor is put into place at P=30, determines the shortage or surplus, if any (think carefully). Draw a graph and show your calculations for full credit.
Use the following supply and demand equations. Supply:p= 4 + 3q. Demand:p= 2,132−q. Use these equations to respond to th...
Use the following supply and demand equations. Supply:p= 4 + 3q. Demand:p= 2,132−q. Use these equations to respond to the following questions. (a) What is the market equilibrium? (b) Under the market equilibrium, what is Total Surplus? (c) Suppose the government enacts a price ceiling of ̄p= 2,000. What is ProducerSurplus, Consumer Surplus, Total Surplus, and Deadweight Loss? (d) Instead, suppose that the government enacts a price ceiling of ̄p= 1,100. What is Producer Surplus, Consumer Surplus, Total Surplus, and...
 1. Use the following supply and demand equations. Supply: p = 4 + 3q. Demand: p=2,132-9. Use these equations to respond to the following questions. (a) What is the market equilibrium? (4%) (b) Under the market equilibrium, what is Total Surplus? (4%) (c) Suppose the government enacts a price ceiling of p= 2, 000. What is Producer Surplus, Consumer Surplus, Total Surplus, and Deadweight Loss? (4%) (d) Instead, suppose that the government enacts a price ceiling of p = 1,100....
 Question 3: Suppose that the demand equation: P- 10-Q and supply equation: P Q a. Calculate the equilibrium price and quantity b. Calculate the consumer surplus, producer surplus and total surplus at equilibriunm Suppose the government imposes a tax of $2 for each unit bought. Derive the new equilibrium price that consumers pay, the price that firms receive, and quantity c. d. Calculate the deadweight loss of this tax. e. In a diagram, show the equilibrium in part a and...
 Need help with 3, 4, and 5
Econ 206 Dr. George Problem Set #2 1) Consider the market for burritos (like Chipotle) a. Draw a supply and demand graph that shows the equilibrium price equal to $3.50 and the equilibrium quantity equal to 200 per day. Show the area of the graph that b. On the graph, show the effect when the price of pizza falls (assuming that pizza and c. On a new graph, show the effect when the...
Need help with 3, 4, and 5
Econ 206 Dr. George Problem Set #2 1) Consider the market for burritos (like Chipotle) a. Draw a supply and demand graph that shows the equilibrium price equal to $3.50 and the equilibrium quantity equal to 200 per day. Show the area of the graph that b. On the graph, show the effect when the price of pizza falls (assuming that pizza and c. On a new graph, show the effect when the...
Most questions answered within 3 hours.
-
Where is the error in this code sequence?
String s1 = "Hello";
String s2 = "ello";...
asked 11 months ago -
Financial data for Joel de Paris, Inc., for last year
follow:
Joel de Paris, Inc.
Balance...
asked 11 months ago -
Consider this reaction:
Al2(SO4)3 (aq)+ BaCl3
(aq) Al2Cl6 (aq)- +
3BaSO4(s) . What is the...
asked 11 months ago -
Suppose that Savneet is considering increasing her
recent random sample from 20 car rentals to 40...
asked 11 months ago -
Trucks arrive at an unloading terminal at an average rate of 120
per hour.
Trucks arrive...
asked 11 months ago -
Why are methanol and ethanol completely soluble in water while
octanol is not very little soluble....
asked 11 months ago -
A facilities manager at a university reads in a research report
that the mean amount of...
asked 11 months ago -
When the CuSO4 is rehydrated by adding water to the anhydrous
compound, is this an endothermic...
asked 11 months ago -
A ray of sunlight is passing from diamond into crown glass; the
angle of incidence is...
asked 11 months ago -
A block of mass 0.249 kg is placed on top of a light, vertical
spring of...
asked 11 months ago -
how do the kidneys compensate in the presences of acidosis
a) trigger hyperventilate
b) reserve acid...
asked 11 months ago -
Question 501 pts
The rental rate of capital to the firm increases. Which of the
following...
asked 11 months ago