


Homework Answers
Request Answer!
We need at least 10 more requests to produce the answer.
0 / 10 have requested this problem solution
The more requests, the faster the answer.
Add Answer to:
last question fails to reject or reject and sufficient and
insufficient.
The accompanying data table lists...
The accompanying data table lists measured voltage amounts supplied directly to a family's home. The power...
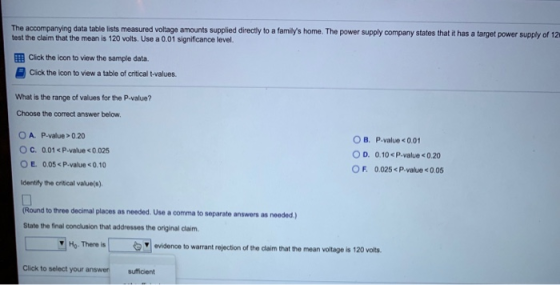
The accompanying data table lists measured voltage amounts supplied directly to a family's home. The power supply company states that it has a target power supply of 120 volts. Using those home voltage amounts, test the claim that the mean is 120 volts. Use a 0.01 significance level. Day Volts 1 123.9 2 123.9 3 123.9 4 124.2 5 123.4 6 123.3 7 123.3 8 123.6 9 123.5 10 123.7 11 123.5 12 123.7 13 124.2 14 123.7 15 123.9...
PG&E states that it has a target power supply of 120 volts. Use the home voltage...
PG&E states that it has a target power supply of 120 volts. Use the home voltage supply amounts in the Voltage data file to test the claim that the mean is 120 volts. Create a histogram of the home voltage data. Copy and paste your histogram here. Does our assumption of normality appear to be satisfied? Yes No What is your null and alternative? H0: µ = 120, H1: µ ≠ 120 H0: µ ≠ 120, H1: µ = 120...
The accompanying data table lists measured voltage amounts supplied directly to a family's home. The power supply company states that it has a target power supply of 120 volts. Using those home v...
 The accompanying data table lists measured voltage amounts supplied directly to a family's home. The power supply company states that it has a target power supply of 120 volts. Using those home voltage amounts, test the claim that the mean is 120 volts. Use a 0.05 significance level. EB Click the icon to view the sample data. Click the icon to view a table of critical t-values. What are the null and alternative hypotheses? ( A. Ho : μ#120 14:11:-120...
The accompanying data table ists measured voltlage amounts supplied drectly to a famly's home The power...
 The accompanying data table ists measured voltlage amounts supplied drectly to a famly's home The power supply company sthat it has a target power supply of 120 volts Using those hone votage amouns. test the dlaim that the men s 120 vols ea Click the icon to viewr the sample data Click the icon to view a table of oritical tvales What are the n and atemative hypotheses? o120 Caloulate the test statsic (Round to three deimal pleces as nended)...
Test whether at the 0.01 level of significance for the sample data shown in the accompanying...
 Test whether at the 0.01 level of significance for the sample data shown in the accompanying table Assume that the populations are normally distributed Click the icon to view the datatable Determine the null and alternative hypothesis for this test OA. HOR Sample Data - X OB. Het Ha OCH 12 n Population 1 33 1035 123 Population 2 25 1145 133 OD. HE 2 Hyh Print Done Determine the value for this hypothesis test P-Round to three decimal places...
The accompanying data table lists the magnitudes of 50 earthquakes measured on the Richter scale. Test...
 The accompanying data table lists the magnitudes of 50 earthquakes measured on the Richter scale. Test the claim that the population of earthquakes has a mean magnitude greater than 1.00. Use a 0.05 significance level. Identify the null hypothesis, alternative hypothesis, test statistic, P-value, and conclusion for the test. Assume this is a simple random sample. Click the icon to view the sample data What are the hypotheses? O B. Ho u + 1.00 in magnitude H:u= 1.00 in magnitude...
The accompanying data table lists the magnitudes of 50 earthquakes measured on the Richter scale. Test...
The accompanying data table lists the magnitudes of 50 earthquakes measured on the Richter scale. Test the claim that the population of earthquakes has a mean magnitude greater than 1.00. Use a 0.01 significance level. Identify the null hypothesis, alternative hypothesis, test statistic, P-value, and conclusion for the test. Assume this is a simple random sample. Magnitude of Earthquake 0.720 0.740 0.640 0.390 0.700 2.200 1.980 0.640 1.220 0.200 1.640 1.320 2.950 0.900 1.760 1.010 1.260 0.000 0.650 1.460...
that's all the data i have. Refer to the data set in the accompanying table. Assume...
 that's all the data i have.
Refer to the data set in the accompanying table. Assume that the paired sample data is a simple random sample and the differences have a distribution that is approximately normal. Use a significance level of 0.01 to test for a difference between the weights of discarded paper in pounds) and weights of discarded plastic (in pounds) E Click the icon to view the data. In this example, He is the mean value of the...
that's all the data i have.
Refer to the data set in the accompanying table. Assume that the paired sample data is a simple random sample and the differences have a distribution that is approximately normal. Use a significance level of 0.01 to test for a difference between the weights of discarded paper in pounds) and weights of discarded plastic (in pounds) E Click the icon to view the data. In this example, He is the mean value of the...
Refer to the accompanying data table, which shows the amounts of nicotine (mg per cigarette) in...
 Refer to the accompanying data table, which shows the amounts of nicotine (mg per cigarette) in king-size cigarettes, 100-mm menthol cigarettes, and 100-mm nonmenthol cigarettes. The king-size cigarettes are nonfiltered, while the 100-mm menthol cigarettes and the 100-mm nonmenthol cigarettes are filtered. Use a 0.05 significance level to test the claim that the three categories of cigarettes yield the same mean amount of nicotine. Given that only the king-size cigarettes are not filtered, do the filters appear to make a...
 The accompanying data table lists measured voltage amounts supplied directly to a family's home. The power supply company states that it has a target power supply of 120 volts. Using those home voltage amounts, test the claim that the mean is 120 volts. Use a 0.05 significance level. EB Click the icon to view the sample data. Click the icon to view a table of critical t-values. What are the null and alternative hypotheses? ( A. Ho : μ#120 14:11:-120...
 The accompanying data table ists measured voltlage amounts supplied drectly to a famly's home The power supply company sthat it has a target power supply of 120 volts Using those hone votage amouns. test the dlaim that the men s 120 vols ea Click the icon to viewr the sample data Click the icon to view a table of oritical tvales What are the n and atemative hypotheses? o120 Caloulate the test statsic (Round to three deimal pleces as nended)...
 Test whether at the 0.01 level of significance for the sample data shown in the accompanying table Assume that the populations are normally distributed Click the icon to view the datatable Determine the null and alternative hypothesis for this test OA. HOR Sample Data - X OB. Het Ha OCH 12 n Population 1 33 1035 123 Population 2 25 1145 133 OD. HE 2 Hyh Print Done Determine the value for this hypothesis test P-Round to three decimal places...
 The accompanying data table lists the magnitudes of 50 earthquakes measured on the Richter scale. Test the claim that the population of earthquakes has a mean magnitude greater than 1.00. Use a 0.05 significance level. Identify the null hypothesis, alternative hypothesis, test statistic, P-value, and conclusion for the test. Assume this is a simple random sample. Click the icon to view the sample data What are the hypotheses? O B. Ho u + 1.00 in magnitude H:u= 1.00 in magnitude...
 that's all the data i have.
Refer to the data set in the accompanying table. Assume that the paired sample data is a simple random sample and the differences have a distribution that is approximately normal. Use a significance level of 0.01 to test for a difference between the weights of discarded paper in pounds) and weights of discarded plastic (in pounds) E Click the icon to view the data. In this example, He is the mean value of the...
that's all the data i have.
Refer to the data set in the accompanying table. Assume that the paired sample data is a simple random sample and the differences have a distribution that is approximately normal. Use a significance level of 0.01 to test for a difference between the weights of discarded paper in pounds) and weights of discarded plastic (in pounds) E Click the icon to view the data. In this example, He is the mean value of the...
 Refer to the accompanying data table, which shows the amounts of nicotine (mg per cigarette) in king-size cigarettes, 100-mm menthol cigarettes, and 100-mm nonmenthol cigarettes. The king-size cigarettes are nonfiltered, while the 100-mm menthol cigarettes and the 100-mm nonmenthol cigarettes are filtered. Use a 0.05 significance level to test the claim that the three categories of cigarettes yield the same mean amount of nicotine. Given that only the king-size cigarettes are not filtered, do the filters appear to make a...
 Refer to the accompanying data table, which shows the amounts of nicotine (mg per cigarette) in king-size cigarettes, 100-mm menthol cigarettes, and 100-mm nonmenthol cigarettes. The king-size cigarettes are nonfiltered, while the 100-mm menthol cigarettes and the 100-mm nonmenthol cigarettes are filtered. Use a 0.05 significance level to test the claim that the three categories of cigarettes yield the same mean amount of nicotine. Given that only the king-size cigarettes are not filtered, do the filters appear to make a...
Most questions answered within 3 hours.
-
Where is the error in this code sequence?
String s1 = "Hello";
String s2 = "ello";...
asked 10 months ago -
Financial data for Joel de Paris, Inc., for last year
follow:
Joel de Paris, Inc.
Balance...
asked 10 months ago -
Consider this reaction:
Al2(SO4)3 (aq)+ BaCl3
(aq) Al2Cl6 (aq)- +
3BaSO4(s) . What is the...
asked 10 months ago -
Suppose that Savneet is considering increasing her
recent random sample from 20 car rentals to 40...
asked 10 months ago -
Trucks arrive at an unloading terminal at an average rate of 120
per hour.
Trucks arrive...
asked 10 months ago -
Why are methanol and ethanol completely soluble in water while
octanol is not very little soluble....
asked 10 months ago -
A facilities manager at a university reads in a research report
that the mean amount of...
asked 10 months ago -
When the CuSO4 is rehydrated by adding water to the anhydrous
compound, is this an endothermic...
asked 10 months ago -
A ray of sunlight is passing from diamond into crown glass; the
angle of incidence is...
asked 10 months ago -
A block of mass 0.249 kg is placed on top of a light, vertical
spring of...
asked 10 months ago -
how do the kidneys compensate in the presences of acidosis
a) trigger hyperventilate
b) reserve acid...
asked 10 months ago -
Question 501 pts
The rental rate of capital to the firm increases. Which of the
following...
asked 10 months ago