
Homework Answers
(a):
Using SPSS:
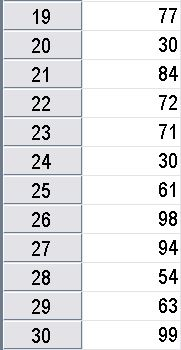
First Enter the data:

Steps for Runs Test:
Analyze-->Non-parametric Test-->Runs
and then select the data:
Output:

Hypothesis:
H0 : Data is random
H1: Data is not random
p-value is 1 that is greater than 0.05, it's mean that is not significant and we fail to reject the null hypothesis,so our data is random.
(b):
When comparing two simulation models, we sometimes use the same set of random number because we want to achieve sharper comparisons and this is called correlated sampling or common random numbers.
Add Answer to:
Consider the following two-digit random decimal numbers: 30, 61, 43, 04, 02, 75, 50, 99, 82,...
Consider the below matrixA, which you can copy and paste directly into Matlab.
Problem #1: Consider the below matrix A, which you can copy and paste directly into Matlab. The matrix contains 3 columns. The first column consists of Test #1 marks, the second column is Test # 2 marks, and the third column is final exam marks for a large linear algebra course. Each row represents a particular student.A = [36 45 75 81 59 73 77 73 73 65 72 78 65 55 83 73 57 78 84 31 60 83...
Write a C program to assign natural numbers 1 to 100 into a one-dimensional integer array....
Write a C program to assign natural numbers 1 to 100 into a one-dimensional integer array. Display all the values in the array on the screen. For each number in the array, determine if the number contains digit 7 or is divisible by 7. Display all those numbers on the screen. Original array: 1 2 3 4 5 6 7 8 9 10 11 12 13 14 15 16 17 18 19 20 21 22 23 24 25 26 27...
Write a python nested for loop that prints out the following pattern 100 99 98 97...
Write a python nested for loop that prints out the following pattern 100 99 98 97 96 95 94 93 92 91 90 89 88 87 86 85 84 83 82 81 80 79 78 77 76 75 74 73 72 71 70 69 68 67 66 65 64 63 62 61 60 59 58 57 56 55 54 53 52 51 50 49 48 47 46 45 44 43 42 41 40 39 38 37 36 35 34 33...
Use the accompanying data set on the pulse rates (in beats per minute) of males to...
Use the accompanying data set on the pulse rates (in beats per minute) of males to complete parts (a) and (b) below. LOADING... Click the icon to view the pulse rates of males. a. Find the mean and standard deviation, and verify that the pulse rates have a distribution that is roughly normal. The mean of the pulse rates is 71.871.8 beats per minute. (Round to one decimal place as needed.) The standard deviation of the pulse rates is 12.212.2...
Please show how you did this in excel. :13-19 Every home football game for the past...
 Please show how you did this in excel.
:13-19 Every home football game for the past eight years at Eastern State University has been sold out. The revenues from ticket sales are significant, but the sale of food, beverages, and souvenirs has contrib- uted greatly to the overall profitability of the football program. One particular souvenir is the football pro- gram for each game. The number of programs sold at each game is described by the following probabil- ity distribution:...
Please show how you did this in excel.
:13-19 Every home football game for the past eight years at Eastern State University has been sold out. The revenues from ticket sales are significant, but the sale of food, beverages, and souvenirs has contrib- uted greatly to the overall profitability of the football program. One particular souvenir is the football pro- gram for each game. The number of programs sold at each game is described by the following probabil- ity distribution:...
Find the indicated measure. The test scores of 40 students are listed below. Find P85. 30...
 Find the indicated measure. The test scores of 40 students are listed below. Find P85. 30 35 43 44 47 48 54 55 56 57 59 62 63 65 66 68 69 69 71 72 72 73 74 76 77 77 78 79 80 81 81 82 83 85 89 92 93 94 97 98 1) 85 2) 87 3) 89 4) 34
The ExceptionLab class provided: – Creates an array of 100 elements and fills it with random...
 The ExceptionLab class provided: – Creates an array of 100
elements and fills it with random numbers from 1 to 100. – It asks
the user for an index value between 0 and 99. – Prints the element
at that position. – If a number > 99 is entered by the user, the
class will abort with an ArrayIndexOutOfBoundsException • Modify
the ExceptionLab: – Add a try-catch clause which intercepts the
ArrayIndexOutOfBounds and prints the message: Index value cannot be...
The ExceptionLab class provided: – Creates an array of 100
elements and fills it with random numbers from 1 to 100. – It asks
the user for an index value between 0 and 99. – Prints the element
at that position. – If a number > 99 is entered by the user, the
class will abort with an ArrayIndexOutOfBoundsException • Modify
the ExceptionLab: – Add a try-catch clause which intercepts the
ArrayIndexOutOfBounds and prints the message: Index value cannot be...
Find the indicated measure. The test scores of 40 students are listed below. Find P85.
Find the indicated measure. The test scores of 40 students are listed below. Find P85. 30 35 43 44 47 48 54 55 56 57 59 62 63 65 66 68 69 69 71 72 72 73 74 76 77 77 78 79 80 81 81 82 83 85 89 92 93 94 97 98 1) 85 2) 87 3) 89 4) 34
02 The following scores represent the final examination grades for an elementary statistics course: 23 60...
 02 The following scores represent the final examination grades for an elementary statistics course: 23 60 79 32 57 74 52 70 82 36 80 77 81 95 41 65 92 85 55 76 52 10 64 75 78 25 80 98 81 67 41 71 83 54 64 72 88 62 74 43 60 78 89 76 84 48 84 90 15 79 34 67 17 82 69 74 63 80 85 61 Calculate: . Stem and leaf ....
1. Forecast demand for Year 4. a. Explain what technique you utilized to forecast your demand....
 1. Forecast demand for Year 4.
a. Explain what technique you utilized to forecast your
demand.
b. Explain why you chose this technique over others.
Year 3 Year 1 Year 2 Actual Actual Actual Forecast Forecast Forecast Demand Demand Demand Week 1 52 57 63 55 66 77 Week 2 49 58 68 69 75 65 Week 3 47 50 58 65 80 74 Week 4 60 53 58 55 78 67 57 Week 5 49 57 64 76 77...
1. Forecast demand for Year 4.
a. Explain what technique you utilized to forecast your
demand.
b. Explain why you chose this technique over others.
Year 3 Year 1 Year 2 Actual Actual Actual Forecast Forecast Forecast Demand Demand Demand Week 1 52 57 63 55 66 77 Week 2 49 58 68 69 75 65 Week 3 47 50 58 65 80 74 Week 4 60 53 58 55 78 67 57 Week 5 49 57 64 76 77...
 Please show how you did this in excel.
:13-19 Every home football game for the past eight years at Eastern State University has been sold out. The revenues from ticket sales are significant, but the sale of food, beverages, and souvenirs has contrib- uted greatly to the overall profitability of the football program. One particular souvenir is the football pro- gram for each game. The number of programs sold at each game is described by the following probabil- ity distribution:...
Please show how you did this in excel.
:13-19 Every home football game for the past eight years at Eastern State University has been sold out. The revenues from ticket sales are significant, but the sale of food, beverages, and souvenirs has contrib- uted greatly to the overall profitability of the football program. One particular souvenir is the football pro- gram for each game. The number of programs sold at each game is described by the following probabil- ity distribution:...
 Find the indicated measure. The test scores of 40 students are listed below. Find P85. 30 35 43 44 47 48 54 55 56 57 59 62 63 65 66 68 69 69 71 72 72 73 74 76 77 77 78 79 80 81 81 82 83 85 89 92 93 94 97 98 1) 85 2) 87 3) 89 4) 34
 The ExceptionLab class provided: – Creates an array of 100
elements and fills it with random numbers from 1 to 100. – It asks
the user for an index value between 0 and 99. – Prints the element
at that position. – If a number > 99 is entered by the user, the
class will abort with an ArrayIndexOutOfBoundsException • Modify
the ExceptionLab: – Add a try-catch clause which intercepts the
ArrayIndexOutOfBounds and prints the message: Index value cannot be...
The ExceptionLab class provided: – Creates an array of 100
elements and fills it with random numbers from 1 to 100. – It asks
the user for an index value between 0 and 99. – Prints the element
at that position. – If a number > 99 is entered by the user, the
class will abort with an ArrayIndexOutOfBoundsException • Modify
the ExceptionLab: – Add a try-catch clause which intercepts the
ArrayIndexOutOfBounds and prints the message: Index value cannot be...
 02 The following scores represent the final examination grades for an elementary statistics course: 23 60 79 32 57 74 52 70 82 36 80 77 81 95 41 65 92 85 55 76 52 10 64 75 78 25 80 98 81 67 41 71 83 54 64 72 88 62 74 43 60 78 89 76 84 48 84 90 15 79 34 67 17 82 69 74 63 80 85 61 Calculate: . Stem and leaf ....
 1. Forecast demand for Year 4.
a. Explain what technique you utilized to forecast your
demand.
b. Explain why you chose this technique over others.
Year 3 Year 1 Year 2 Actual Actual Actual Forecast Forecast Forecast Demand Demand Demand Week 1 52 57 63 55 66 77 Week 2 49 58 68 69 75 65 Week 3 47 50 58 65 80 74 Week 4 60 53 58 55 78 67 57 Week 5 49 57 64 76 77...
1. Forecast demand for Year 4.
a. Explain what technique you utilized to forecast your
demand.
b. Explain why you chose this technique over others.
Year 3 Year 1 Year 2 Actual Actual Actual Forecast Forecast Forecast Demand Demand Demand Week 1 52 57 63 55 66 77 Week 2 49 58 68 69 75 65 Week 3 47 50 58 65 80 74 Week 4 60 53 58 55 78 67 57 Week 5 49 57 64 76 77...
Most questions answered within 3 hours.
-
Where is the error in this code sequence?
String s1 = "Hello";
String s2 = "ello";...
asked 1 year ago -
Financial data for Joel de Paris, Inc., for last year
follow:
Joel de Paris, Inc.
Balance...
asked 1 year ago -
Consider this reaction:
Al2(SO4)3 (aq)+ BaCl3
(aq) Al2Cl6 (aq)- +
3BaSO4(s) . What is the...
asked 1 year ago -
Suppose that Savneet is considering increasing her
recent random sample from 20 car rentals to 40...
asked 1 year ago -
Trucks arrive at an unloading terminal at an average rate of 120
per hour.
Trucks arrive...
asked 1 year ago -
Why are methanol and ethanol completely soluble in water while
octanol is not very little soluble....
asked 1 year ago -
A facilities manager at a university reads in a research report
that the mean amount of...
asked 1 year ago -
When the CuSO4 is rehydrated by adding water to the anhydrous
compound, is this an endothermic...
asked 1 year ago -
A ray of sunlight is passing from diamond into crown glass; the
angle of incidence is...
asked 1 year ago -
A block of mass 0.249 kg is placed on top of a light, vertical
spring of...
asked 1 year ago -
how do the kidneys compensate in the presences of acidosis
a) trigger hyperventilate
b) reserve acid...
asked 1 year ago -
Question 501 pts
The rental rate of capital to the firm increases. Which of the
following...
asked 1 year ago