


Homework Answers
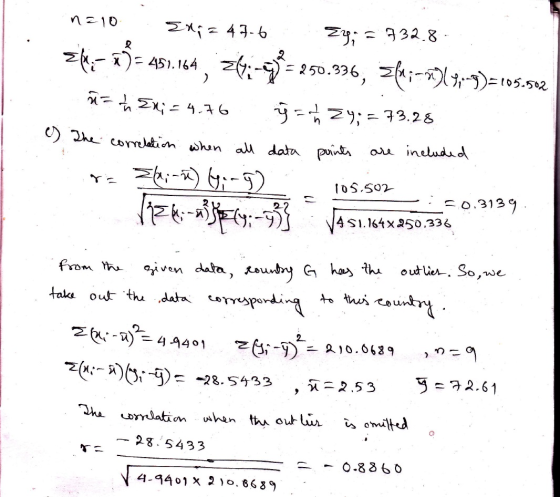
| Country | Birth (x) | Life Exp (y) | (x-x_)^2 | (y-y_)^2 | (x-x_)(y-y_) |
| A | 2.2 | 74.6 | 6.5536 | 1.7424 | -3.3792 |
| B | 1.7 | 75.6 | 9.3636 | 5.3824 | -7.0992 |
| C | 3.7 | 63.9 | 1.1236 | 87.9844 | 9.9428 |
| D | 1.5 | 79.6 | 10.6276 | 39.9424 | -20.6032 |
| E | 2.4 | 72.2 | 5.5696 | 1.1664 | 2.5488 |
| F | 2.9 | 67.4 | 3.4596 | 34.5744 | 10.9368 |
| G | 24.8 | 79.3 | 401.6016 | 36.2404 | 120.6408 |
| H | 3.7 | 68.1 | 1.1236 | 26.8324 | 5.4908 |
| I | 2.1 | 75.3 | 7.0756 | 4.0804 | -5.3732 |
| J | 2.6 | 76.8 | 4.6656 | 12.3904 | -7.6032 |
| Total | 47.6 | 732.8 | 451.164 | 250.336 | 105.502 |
After delating the outlier observation
| Country | Birth (x) | Life Exp (y) | (x-x_)^2 | (y-y_)^2 | (x-x_)(y-y_) |
| A | 2.2 | 74.6 | 0.1089 | 3.9601 | -0.6567 |
| B | 1.7 | 75.6 | 0.6889 | 8.9401 | -2.4817 |
| C | 3.7 | 63.9 | 1.3689 | 75.8641 | -10.1907 |
| D | 1.5 | 79.6 | 1.0609 | 48.8601 | -7.1997 |
| E | 2.4 | 72.2 | 0.0169 | 0.1681 | 0.0533 |
| F | 2.9 | 67.4 | 0.1369 | 27.1441 | -1.9277 |
| H | 3.7 | 68.1 | 1.3689 | 20.3401 | -5.2767 |
| I | 2.1 | 75.3 | 0.1849 | 7.2361 | -1.1567 |
| J | 2.6 | 76.8 | 0.0049 | 17.5561 | 0.2933 |
| Total | 22.8 | 653.5 | 4.9401 | 210.0689 | -28.5433 |

Add Answer to:
HI ISLI UCIUI-Liedleu quesLIUI Country Data from 10 countries can be used to examine the association...
Might we be able to predict life expectancies from birthrates? Below are bivariate data giving birthrate...
 Might we be able to predict life expectancies from birthrates? Below are bivariate data giving birthrate and life expectancy information for each of twelve countries. For each of the countries, both x, the number of births per one thousand people in the population, and y, the female life expectancy (in years), are given. Also shown are the scatter plot for the data and the least squares regression line. The equation for this line is 9 = = 82.46 -0.48x Birthrate,...
Use the given data to find the equation of the regression line. Examine the scatterplot and...
Use the given data to find the equation of the regression line. Examine the scatterplot and identify a characteristic of the data that is ignored by the regression line. x 11 8 11 8 12 13 7 4 12 6 5 y 7.58 6.69 13.24 7.32 7.62 8.52 6.09 5.15 8.13 6.15 5.52 Find the equation of the regression line. (Round the constant two decimal places as needed. Round the coefficient to three decimal places as needed.)
The table below shows the life expectancy for an individual born in the United States in...
The table below shows the life expectancy for an individual born in the United States in certain years. Year of Birth Life Expectancy CHART W NUMBERS IS BELOW Part (a) Decide which variable should be the independent variable and which should be the dependent variable. A)Independent: year of birth; Dependent: life expectancy Independent: life expectancy; B) Dependent: year of birth Incorrect: Your answer is incorrect. Part (b) Draw a scatter plot of the ordered pairs. Part (c) Calculate the least...
Suppose that you have in your possession bivariate data giving birthrate and life expectancy information for...
 Suppose that you have in your possession bivariate data giving birthrate and life expectancy information for a random sample of 15 countries. For each of the countries, the data give both x, the number of births per one thousand people in the country's population, and y, the country's female life expectancy in years. The least squares regression equation computed from your data is y = 84.06 -0.51x. Suppose that you're predicting the female life expectancy for a country whose birthrate...
1. 2. 3. Use the given data to find the equation of the regression line. Examine...
 1.
2.
3.
Use the given data to find the equation of the regression line. Examine the scatterplot and identify a characteristic of the data that is ignored by the regression line. X 5 14 13.31 13 13.66 12 13.74 10 13.05 9 12.30 4 4.31 6 8.34 8 11.25 11 13.54 7 9.94 y 6.46 = 3.00 + 0.80 (Round to two decimal places as needed.) The data show the chest size and weight of several bears. Find the...
1.
2.
3.
Use the given data to find the equation of the regression line. Examine the scatterplot and identify a characteristic of the data that is ignored by the regression line. X 5 14 13.31 13 13.66 12 13.74 10 13.05 9 12.30 4 4.31 6 8.34 8 11.25 11 13.54 7 9.94 y 6.46 = 3.00 + 0.80 (Round to two decimal places as needed.) The data show the chest size and weight of several bears. Find the...
Use the given data to find the equation of the regression ine. Examine the scatterplot and...
 Use the given data to find the equation of the regression ine. Examine the scatterplot and identity a characteristic of the data that is ignored by the regression ine. 10 8 13 10 12 13 5 4 11 8 6 y 7.44 6.64 12.51 6.86 7.57 8.69 6.19 5.14 8.5 6.63 5.7 Create a soutterplot of the data. Choose the correct graph below. OA ов. Oc. OD. 25+ 20 a 20 151 10 15 10 15 10 10 G G...
B. Predict the number of software millionaire birthdays that will occur in a decade where the...
 B. Predict the number of software
millionaire birthdays that will occur in a decade where the total
number of births in this country is 35 million. ( round to 2
decimal places as needed)
C. Fit a simple linear regression model relating number (y) of
software millionaire birthdays in a decade to number (x) of CEO
birthdays. give the least squares prediction equation. (
round to 2 decimal places as needed)
D. Predict the number of software millionaire birthdays that
will...
B. Predict the number of software
millionaire birthdays that will occur in a decade where the total
number of births in this country is 35 million. ( round to 2
decimal places as needed)
C. Fit a simple linear regression model relating number (y) of
software millionaire birthdays in a decade to number (x) of CEO
birthdays. give the least squares prediction equation. (
round to 2 decimal places as needed)
D. Predict the number of software millionaire birthdays that
will...
1) The highway mileage (mpg) for a sample of 8 different models of a car company...
1) The highway mileage (mpg) for a sample of 8 different models of a car company can be found below. 17, 21, 23, 26, 36, 29, 33, 36 Find the 5-number summary, check for any outliers using fences, and create a boxplot. Use the space below to type your answers AND/OR to upload a picture of your work for all the questions in this problem. 2) A regression was run to determine if there is a relationship between the happiness...
0 Use the given data to find the equation of the regression line. Examine the scatterplot...
 0 Use the given data to find the equation of the regression line. Examine the scatterplot and identify a characteristic of the data that is ignored by the regression line X 9 9 12 9 12 13 6 4 11 6 6 6.99 12.56 6.96 8.03 8.99 5.89 5.39 853 621 5.98 Create a scatterplot of the data. Choose the correct graph below y 7.45 ОА OB oc OD. Ay 25 20 20 15 10 5 26 20- 15 10...
Use the given data to find the equation of the regression line. Examine the scatterplot and identify a characteristic o...
 Use the given data to find the equation of the regression line. Examine the scatterplot and identify a characteristic of the data that is ignored by the regression line 10 D y 11.36 1117 1062 5.39 861 7.16 1032 1099 332 977 1141 y(Round to two decimal places as needed.) Creats a scatterplot of the data Choose the correct graph below OA ов. O C. 0 5 10 15 20 25 5 10 15 20 25 0 5 10 15...
 Might we be able to predict life expectancies from birthrates? Below are bivariate data giving birthrate and life expectancy information for each of twelve countries. For each of the countries, both x, the number of births per one thousand people in the population, and y, the female life expectancy (in years), are given. Also shown are the scatter plot for the data and the least squares regression line. The equation for this line is 9 = = 82.46 -0.48x Birthrate,...
 Suppose that you have in your possession bivariate data giving birthrate and life expectancy information for a random sample of 15 countries. For each of the countries, the data give both x, the number of births per one thousand people in the country's population, and y, the country's female life expectancy in years. The least squares regression equation computed from your data is y = 84.06 -0.51x. Suppose that you're predicting the female life expectancy for a country whose birthrate...
 1.
2.
3.
Use the given data to find the equation of the regression line. Examine the scatterplot and identify a characteristic of the data that is ignored by the regression line. X 5 14 13.31 13 13.66 12 13.74 10 13.05 9 12.30 4 4.31 6 8.34 8 11.25 11 13.54 7 9.94 y 6.46 = 3.00 + 0.80 (Round to two decimal places as needed.) The data show the chest size and weight of several bears. Find the...
1.
2.
3.
Use the given data to find the equation of the regression line. Examine the scatterplot and identify a characteristic of the data that is ignored by the regression line. X 5 14 13.31 13 13.66 12 13.74 10 13.05 9 12.30 4 4.31 6 8.34 8 11.25 11 13.54 7 9.94 y 6.46 = 3.00 + 0.80 (Round to two decimal places as needed.) The data show the chest size and weight of several bears. Find the...
 Use the given data to find the equation of the regression ine. Examine the scatterplot and identity a characteristic of the data that is ignored by the regression ine. 10 8 13 10 12 13 5 4 11 8 6 y 7.44 6.64 12.51 6.86 7.57 8.69 6.19 5.14 8.5 6.63 5.7 Create a soutterplot of the data. Choose the correct graph below. OA ов. Oc. OD. 25+ 20 a 20 151 10 15 10 15 10 10 G G...
 B. Predict the number of software
millionaire birthdays that will occur in a decade where the total
number of births in this country is 35 million. ( round to 2
decimal places as needed)
C. Fit a simple linear regression model relating number (y) of
software millionaire birthdays in a decade to number (x) of CEO
birthdays. give the least squares prediction equation. (
round to 2 decimal places as needed)
D. Predict the number of software millionaire birthdays that
will...
B. Predict the number of software
millionaire birthdays that will occur in a decade where the total
number of births in this country is 35 million. ( round to 2
decimal places as needed)
C. Fit a simple linear regression model relating number (y) of
software millionaire birthdays in a decade to number (x) of CEO
birthdays. give the least squares prediction equation. (
round to 2 decimal places as needed)
D. Predict the number of software millionaire birthdays that
will...
 0 Use the given data to find the equation of the regression line. Examine the scatterplot and identify a characteristic of the data that is ignored by the regression line X 9 9 12 9 12 13 6 4 11 6 6 6.99 12.56 6.96 8.03 8.99 5.89 5.39 853 621 5.98 Create a scatterplot of the data. Choose the correct graph below y 7.45 ОА OB oc OD. Ay 25 20 20 15 10 5 26 20- 15 10...
 Use the given data to find the equation of the regression line. Examine the scatterplot and identify a characteristic of the data that is ignored by the regression line 10 D y 11.36 1117 1062 5.39 861 7.16 1032 1099 332 977 1141 y(Round to two decimal places as needed.) Creats a scatterplot of the data Choose the correct graph below OA ов. O C. 0 5 10 15 20 25 5 10 15 20 25 0 5 10 15...
Most questions answered within 3 hours.
-
Where is the error in this code sequence?
String s1 = "Hello";
String s2 = "ello";...
asked 10 months ago -
Financial data for Joel de Paris, Inc., for last year
follow:
Joel de Paris, Inc.
Balance...
asked 10 months ago -
Consider this reaction:
Al2(SO4)3 (aq)+ BaCl3
(aq) Al2Cl6 (aq)- +
3BaSO4(s) . What is the...
asked 10 months ago -
Suppose that Savneet is considering increasing her
recent random sample from 20 car rentals to 40...
asked 10 months ago -
Trucks arrive at an unloading terminal at an average rate of 120
per hour.
Trucks arrive...
asked 10 months ago -
Why are methanol and ethanol completely soluble in water while
octanol is not very little soluble....
asked 10 months ago -
A facilities manager at a university reads in a research report
that the mean amount of...
asked 10 months ago -
When the CuSO4 is rehydrated by adding water to the anhydrous
compound, is this an endothermic...
asked 10 months ago -
A ray of sunlight is passing from diamond into crown glass; the
angle of incidence is...
asked 10 months ago -
A block of mass 0.249 kg is placed on top of a light, vertical
spring of...
asked 10 months ago -
how do the kidneys compensate in the presences of acidosis
a) trigger hyperventilate
b) reserve acid...
asked 10 months ago -
Question 501 pts
The rental rate of capital to the firm increases. Which of the
following...
asked 10 months ago