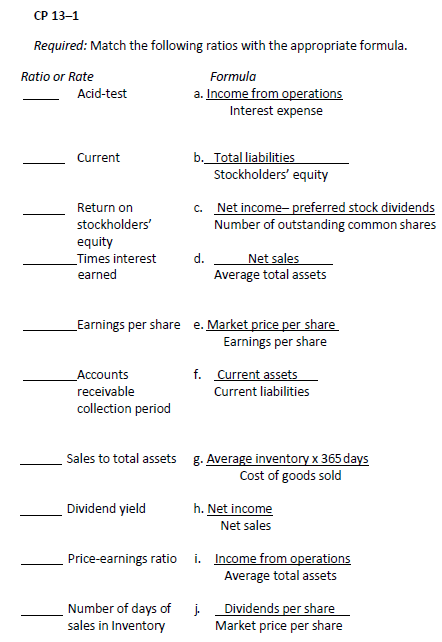
CP 13–1
Required: Match the following ratios with the appropriate
formula.
I have attached the full question and workbook for the answers to be filled into below. The answers MUST BE PUT INTO THIS WORKBOOK FORMAT or I won't understand them. Also, I can't understand handwriting that's not my own, so please DO NOT give handwritten answers. Thank you!

This is the Workbook below:

Homework Answers

Add Answer to:
CP 13–1
Required: Match the following ratios with the appropriate
formula.
I have attached the full...
Q-2 FINANCIAL RATIO FORMULAS Match each of the following financial ratios with its formula: Accounts Payable...
 Q-2 FINANCIAL RATIO FORMULAS Match each of the following financial ratios with its formula: Accounts Payable Tunover Ratio Fixed Asset Turnover Ratio Asset Turnover Ratio Cash Coverage Ratio Cash Ratio Current Ratio Average Age of Receivables Average Days Supply in Inventory Receivable Turnover Ratio Debt-to-Equity Ratio Earnings per Share (EPS) Financial Leverage Percentage Times Interest Earned Ratio Inventory Turnover Ratico Price/ Earnings (P/E) Ratio Profit Margin Quality of Income Quick Ratio Return on Equity (ROE) Return on Assets (ROA) A....
Hi need some help Calculating the Liquidity, solvency and profitability of Marriott Intercontinental with the Financial...
 Hi
need some help Calculating the Liquidity, solvency and
profitability of Marriott Intercontinental with the Financial
Statement of Year 2012. Please, I would appreciate a brief
description of how was calculated everything to understand the
exercise.
Liquidity Working capital Current ratio Current cash debt coverage Inventory turnover Days in inventory Accounts receivable turnover Average collection period Current assets-Current liabilities Current assets Current liabilities Net cash provided by operating activities Average current liabilities Cost of goods sold Average inventory 365 days...
Hi
need some help Calculating the Liquidity, solvency and
profitability of Marriott Intercontinental with the Financial
Statement of Year 2012. Please, I would appreciate a brief
description of how was calculated everything to understand the
exercise.
Liquidity Working capital Current ratio Current cash debt coverage Inventory turnover Days in inventory Accounts receivable turnover Average collection period Current assets-Current liabilities Current assets Current liabilities Net cash provided by operating activities Average current liabilities Cost of goods sold Average inventory 365 days...
Problem 13-02A (Video) The comparative statements of Carla Vista Co. are presented here: Carla Vista Co....
 Problem 13-02A (Video) The comparative statements of Carla Vista Co. are presented here: Carla Vista Co. Income Statements For the Years Ended December 31 2020 Net sales $1,897,540 Cost of goods sold 1,065,540 Gross profit 832,000 Selling and administrative expenses 507,000 Income from operations 325,000 Other expenses and losses Interest expense 24,000 Income before income taxes 301,000 Income tax expense 94,000 Net income $207,000 2019 $1,757,500 1,013,000 744,500 486,000 258,500 22,000 236,500 75,000 $161,500 2020 2019 Carla Vista Co. Balance...
Problem 13-02A The comparative statements of Cullumber Company are presented here. CULLUMBER COMPANY Income Statements For...
 Problem 13-02A
The comparative statements of Cullumber Company are presented
here.
CULLUMBER COMPANY
Income Statements
For the Years Ended December 31
2022
2021
Net sales
$1,586,400
$1,470,000
Cost of goods sold
887,000
845,040
Gross profit
699,400
624,960
Selling and administrative expenses
420,000
402,360
Income from operations
279,400
222,600
Other expenses and losses
Interest expense
18,480
16,800
Income before income taxes
260,920
205,800
Income tax expense
78,276
61,740
Net income
$ 182,644
$ 144,060
CULLUMBER COMPANY
Balance Sheets
December 31
Assets...
Problem 13-02A
The comparative statements of Cullumber Company are presented
here.
CULLUMBER COMPANY
Income Statements
For the Years Ended December 31
2022
2021
Net sales
$1,586,400
$1,470,000
Cost of goods sold
887,000
845,040
Gross profit
699,400
624,960
Selling and administrative expenses
420,000
402,360
Income from operations
279,400
222,600
Other expenses and losses
Interest expense
18,480
16,800
Income before income taxes
260,920
205,800
Income tax expense
78,276
61,740
Net income
$ 182,644
$ 144,060
CULLUMBER COMPANY
Balance Sheets
December 31
Assets...
$1,000,000 3 Requested loan amount HEDRICK COMPANY Comparative Balance Sheet This Year Last Year 9 Assets 10 Current assets: 11 Cash 12 Marketable securities 13 Accounts receivable, net 14 Inv...
 $1,000,000 3 Requested loan amount HEDRICK COMPANY Comparative Balance Sheet This Year Last Year 9 Assets 10 Current assets: 11 Cash 12 Marketable securities 13 Accounts receivable, net 14 Inventory 15 Prepaid expenses $320,000 $420,000 100,000 600,000 1,300,000 800,000 60,000 2,600,0001,980,000 3,100,000 2,980,000 5700,000 4960,000 80,000 16 Total current assets 17 Plant and equipment, net 18 Total assets 19 20 Liabilities and Stockholders' Equity 21 Liabilities: 22 Current liabilities 23į Bonds payable, 10% 24 Total liabilities 25 Stockholders' equity 26...
Required information [The following information applies to the questions displayed below.] You have just been hired...
Required information [The following information applies to the questions displayed below.] You have just been hired as a financial analyst for Lydex Company, a manufacturer of safety helmets. Your boss has asked you to perform a comprehensive analysis of the company’s financial statements, including comparing Lydex’s performance to its major competitors. The company’s financial statements for the last two years are as follows: Lydex Company Comparative Balance Sheet This Year Last Year Assets Current assets: Cash $ 1,020,000 $ 1,260,000...
QUESTION 3 From following financial statements, calculate following ratios and analyse the current year and previous...
 QUESTION 3 From following financial statements, calculate following ratios and analyse the current year and previous year performance a) Current ratio. b) Days sales outstanding (DSO). (Sales 2017 RM500m & Sales 2018 RM600m) c) Inventory turnover ratio d) Total debt to assets e) Return on assets (ROA) (Net income 2017 RM42m &Net income 2018 RM58m) Moon Inc. Balance Sheet (RM millions) as at December 31, 2015 and 2016 2015 21 51 2016 20 84 Cash Accounts receivable Inventory Prepaid expenses...
EXERCISE - CHAPTER 19. RATIOS: From the following Information, compute the ratios indicated and place the...
 EXERCISE - CHAPTER 19. RATIOS: From the following Information, compute the ratios indicated and place the proper number in the blanks provided. ASSETS: Cash $10,000 Marketable Securities $15,000 Accounts Receivable, Net $20,000 Inventory $30,000 Prepaid Assets $ 5,000 Property, Plant & Equipment $100,000 Total Assets: $180,000 LIABILITIES & STOCKHOLDERS' EQUITY: Current Liabilities $20,000 Long-Term Liabilities $80,000 Stockholders' Equity $80,000 Total Liabilities & Stockholder's Equity: $180,000 Sales $200,000 Cost of Goods Sold $150.000 Gross Margin $ 50,000 Operating Expense $ 30,000...
CP 13 – 6 In the left‐hand column, a series of independent transactions is listed; in the right‐hand column, a series of ratios is listed. Effect on ratio No Transaction Ratio Increase Decrease change...
 CP 13 – 6 In the left‐hand column, a series of independent
transactions is listed; in the right‐hand column, a series of
ratios is listed. Effect on ratio No Transaction Ratio Increase
Decrease change Wrote‐off an uncollectible account receivable
Accounts receivable collection period Issued 10‐year bonds to
acquire plant assets Return on total assets Declared a stock
dividend on common shares Earnings per share Paid a current
creditor in full Acid‐test ratio Required: For each transaction
indicate whether the ratio...
CP 13 – 6 In the left‐hand column, a series of independent
transactions is listed; in the right‐hand column, a series of
ratios is listed. Effect on ratio No Transaction Ratio Increase
Decrease change Wrote‐off an uncollectible account receivable
Accounts receivable collection period Issued 10‐year bonds to
acquire plant assets Return on total assets Declared a stock
dividend on common shares Earnings per share Paid a current
creditor in full Acid‐test ratio Required: For each transaction
indicate whether the ratio...
Please, someone, help me! If you do please show working out for me to understand. Thank...
 Please, someone, help me! If you do please show working
out for me to understand. Thank you.
Measures of liquidity, Solvency, and Profitability The
comparative financial statements of Marshall Inc. are as follows.
The market price of Marshall common stock was $ 65 on December 31,
20Y2.
Marshall Inc.
Comparative Retained Earnings
Statement
For the Years Ended December 31, 20Y2 and
20Y1
20Y2
20Y1
Retained earnings, January 1
$1,262,900
$1,069,600
Net income
300,000
219,100
Total
$1,562,900
$1,288,700
Dividends:
On preferred...
Please, someone, help me! If you do please show working
out for me to understand. Thank you.
Measures of liquidity, Solvency, and Profitability The
comparative financial statements of Marshall Inc. are as follows.
The market price of Marshall common stock was $ 65 on December 31,
20Y2.
Marshall Inc.
Comparative Retained Earnings
Statement
For the Years Ended December 31, 20Y2 and
20Y1
20Y2
20Y1
Retained earnings, January 1
$1,262,900
$1,069,600
Net income
300,000
219,100
Total
$1,562,900
$1,288,700
Dividends:
On preferred...
 Q-2 FINANCIAL RATIO FORMULAS Match each of the following financial ratios with its formula: Accounts Payable Tunover Ratio Fixed Asset Turnover Ratio Asset Turnover Ratio Cash Coverage Ratio Cash Ratio Current Ratio Average Age of Receivables Average Days Supply in Inventory Receivable Turnover Ratio Debt-to-Equity Ratio Earnings per Share (EPS) Financial Leverage Percentage Times Interest Earned Ratio Inventory Turnover Ratico Price/ Earnings (P/E) Ratio Profit Margin Quality of Income Quick Ratio Return on Equity (ROE) Return on Assets (ROA) A....
 Hi
need some help Calculating the Liquidity, solvency and
profitability of Marriott Intercontinental with the Financial
Statement of Year 2012. Please, I would appreciate a brief
description of how was calculated everything to understand the
exercise.
Liquidity Working capital Current ratio Current cash debt coverage Inventory turnover Days in inventory Accounts receivable turnover Average collection period Current assets-Current liabilities Current assets Current liabilities Net cash provided by operating activities Average current liabilities Cost of goods sold Average inventory 365 days...
Hi
need some help Calculating the Liquidity, solvency and
profitability of Marriott Intercontinental with the Financial
Statement of Year 2012. Please, I would appreciate a brief
description of how was calculated everything to understand the
exercise.
Liquidity Working capital Current ratio Current cash debt coverage Inventory turnover Days in inventory Accounts receivable turnover Average collection period Current assets-Current liabilities Current assets Current liabilities Net cash provided by operating activities Average current liabilities Cost of goods sold Average inventory 365 days...
 Problem 13-02A (Video) The comparative statements of Carla Vista Co. are presented here: Carla Vista Co. Income Statements For the Years Ended December 31 2020 Net sales $1,897,540 Cost of goods sold 1,065,540 Gross profit 832,000 Selling and administrative expenses 507,000 Income from operations 325,000 Other expenses and losses Interest expense 24,000 Income before income taxes 301,000 Income tax expense 94,000 Net income $207,000 2019 $1,757,500 1,013,000 744,500 486,000 258,500 22,000 236,500 75,000 $161,500 2020 2019 Carla Vista Co. Balance...
 Problem 13-02A
The comparative statements of Cullumber Company are presented
here.
CULLUMBER COMPANY
Income Statements
For the Years Ended December 31
2022
2021
Net sales
$1,586,400
$1,470,000
Cost of goods sold
887,000
845,040
Gross profit
699,400
624,960
Selling and administrative expenses
420,000
402,360
Income from operations
279,400
222,600
Other expenses and losses
Interest expense
18,480
16,800
Income before income taxes
260,920
205,800
Income tax expense
78,276
61,740
Net income
$ 182,644
$ 144,060
CULLUMBER COMPANY
Balance Sheets
December 31
Assets...
Problem 13-02A
The comparative statements of Cullumber Company are presented
here.
CULLUMBER COMPANY
Income Statements
For the Years Ended December 31
2022
2021
Net sales
$1,586,400
$1,470,000
Cost of goods sold
887,000
845,040
Gross profit
699,400
624,960
Selling and administrative expenses
420,000
402,360
Income from operations
279,400
222,600
Other expenses and losses
Interest expense
18,480
16,800
Income before income taxes
260,920
205,800
Income tax expense
78,276
61,740
Net income
$ 182,644
$ 144,060
CULLUMBER COMPANY
Balance Sheets
December 31
Assets...
 $1,000,000 3 Requested loan amount HEDRICK COMPANY Comparative Balance Sheet This Year Last Year 9 Assets 10 Current assets: 11 Cash 12 Marketable securities 13 Accounts receivable, net 14 Inventory 15 Prepaid expenses $320,000 $420,000 100,000 600,000 1,300,000 800,000 60,000 2,600,0001,980,000 3,100,000 2,980,000 5700,000 4960,000 80,000 16 Total current assets 17 Plant and equipment, net 18 Total assets 19 20 Liabilities and Stockholders' Equity 21 Liabilities: 22 Current liabilities 23į Bonds payable, 10% 24 Total liabilities 25 Stockholders' equity 26...
 QUESTION 3 From following financial statements, calculate following ratios and analyse the current year and previous year performance a) Current ratio. b) Days sales outstanding (DSO). (Sales 2017 RM500m & Sales 2018 RM600m) c) Inventory turnover ratio d) Total debt to assets e) Return on assets (ROA) (Net income 2017 RM42m &Net income 2018 RM58m) Moon Inc. Balance Sheet (RM millions) as at December 31, 2015 and 2016 2015 21 51 2016 20 84 Cash Accounts receivable Inventory Prepaid expenses...
 EXERCISE - CHAPTER 19. RATIOS: From the following Information, compute the ratios indicated and place the proper number in the blanks provided. ASSETS: Cash $10,000 Marketable Securities $15,000 Accounts Receivable, Net $20,000 Inventory $30,000 Prepaid Assets $ 5,000 Property, Plant & Equipment $100,000 Total Assets: $180,000 LIABILITIES & STOCKHOLDERS' EQUITY: Current Liabilities $20,000 Long-Term Liabilities $80,000 Stockholders' Equity $80,000 Total Liabilities & Stockholder's Equity: $180,000 Sales $200,000 Cost of Goods Sold $150.000 Gross Margin $ 50,000 Operating Expense $ 30,000...
 CP 13 – 6 In the left‐hand column, a series of independent
transactions is listed; in the right‐hand column, a series of
ratios is listed. Effect on ratio No Transaction Ratio Increase
Decrease change Wrote‐off an uncollectible account receivable
Accounts receivable collection period Issued 10‐year bonds to
acquire plant assets Return on total assets Declared a stock
dividend on common shares Earnings per share Paid a current
creditor in full Acid‐test ratio Required: For each transaction
indicate whether the ratio...
CP 13 – 6 In the left‐hand column, a series of independent
transactions is listed; in the right‐hand column, a series of
ratios is listed. Effect on ratio No Transaction Ratio Increase
Decrease change Wrote‐off an uncollectible account receivable
Accounts receivable collection period Issued 10‐year bonds to
acquire plant assets Return on total assets Declared a stock
dividend on common shares Earnings per share Paid a current
creditor in full Acid‐test ratio Required: For each transaction
indicate whether the ratio...
 Please, someone, help me! If you do please show working
out for me to understand. Thank you.
Measures of liquidity, Solvency, and Profitability The
comparative financial statements of Marshall Inc. are as follows.
The market price of Marshall common stock was $ 65 on December 31,
20Y2.
Marshall Inc.
Comparative Retained Earnings
Statement
For the Years Ended December 31, 20Y2 and
20Y1
20Y2
20Y1
Retained earnings, January 1
$1,262,900
$1,069,600
Net income
300,000
219,100
Total
$1,562,900
$1,288,700
Dividends:
On preferred...
Please, someone, help me! If you do please show working
out for me to understand. Thank you.
Measures of liquidity, Solvency, and Profitability The
comparative financial statements of Marshall Inc. are as follows.
The market price of Marshall common stock was $ 65 on December 31,
20Y2.
Marshall Inc.
Comparative Retained Earnings
Statement
For the Years Ended December 31, 20Y2 and
20Y1
20Y2
20Y1
Retained earnings, January 1
$1,262,900
$1,069,600
Net income
300,000
219,100
Total
$1,562,900
$1,288,700
Dividends:
On preferred...
Most questions answered within 3 hours.
-
Where is the error in this code sequence?
String s1 = "Hello";
String s2 = "ello";...
asked 10 months ago -
Financial data for Joel de Paris, Inc., for last year
follow:
Joel de Paris, Inc.
Balance...
asked 10 months ago -
Consider this reaction:
Al2(SO4)3 (aq)+ BaCl3
(aq) Al2Cl6 (aq)- +
3BaSO4(s) . What is the...
asked 10 months ago -
Suppose that Savneet is considering increasing her
recent random sample from 20 car rentals to 40...
asked 10 months ago -
Trucks arrive at an unloading terminal at an average rate of 120
per hour.
Trucks arrive...
asked 10 months ago -
Why are methanol and ethanol completely soluble in water while
octanol is not very little soluble....
asked 10 months ago -
A facilities manager at a university reads in a research report
that the mean amount of...
asked 10 months ago -
When the CuSO4 is rehydrated by adding water to the anhydrous
compound, is this an endothermic...
asked 10 months ago -
A ray of sunlight is passing from diamond into crown glass; the
angle of incidence is...
asked 10 months ago -
A block of mass 0.249 kg is placed on top of a light, vertical
spring of...
asked 10 months ago -
how do the kidneys compensate in the presences of acidosis
a) trigger hyperventilate
b) reserve acid...
asked 10 months ago -
Question 501 pts
The rental rate of capital to the firm increases. Which of the
following...
asked 10 months ago