
Homework Answers
The aggregate expenditure line changes with the relative change in the price level, the aggregate expenditure is the sum of consumption, investment , government expenditure and net exports. If the price level were to change that would affect all these components. If there is a decrease in the price level , that is an increase in the value of the money and this will induce the consumption to increase. This is a upward shift in the aggregate expenditure line.
The price level also influence the quantity of money and there by the interest rate, if there is a decrease in the price level that would increase the quantity of money so there will be a lower interest rate. The cost for borrowing is the interest rate so this would induce the investment.
The price level also affects the net exports , a decrease in the price level will increase the foreign demand for domestic products and there will be an increase in the net exports.
Add Answer to:
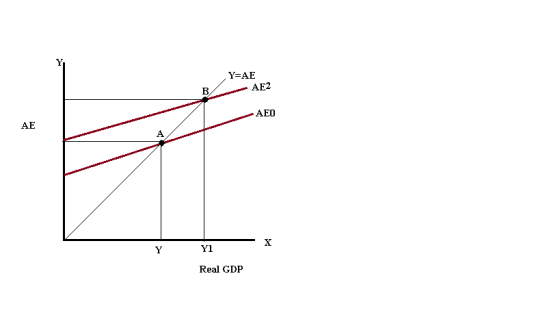
The graph to the right shows a 45°-line (Keynesian cross) diagram. The economy is currently in...
please do all questions correctly do the graph as well please Refer to the diagram to...
 please do all questions correctly
do the graph as well please
Refer to the diagram to the right. Initially, the aggregate expenditure curve is given by the following equation AE = 400 +0.60Y 2,000 1,800 The equilibrium level of income in this economy is equal to $ . (Round your response to the nearest dollar.) 1,60% 1,400 Suppose that the level of autonomous investment expenditures in this economy decreases by $200. esired Aggregate Expenditure 1. Use the line drawing tool...
please do all questions correctly
do the graph as well please
Refer to the diagram to the right. Initially, the aggregate expenditure curve is given by the following equation AE = 400 +0.60Y 2,000 1,800 The equilibrium level of income in this economy is equal to $ . (Round your response to the nearest dollar.) 1,60% 1,400 Suppose that the level of autonomous investment expenditures in this economy decreases by $200. esired Aggregate Expenditure 1. Use the line drawing tool...
The graph to the right shows a situation in which the economy was in equilibrium at potential GDP (at point A) when the...
 The graph to the right shows a situation in which the economy was in equilibrium at potential GDP (at point A) when the demand for housing sharply declined. What actions can the federal government take to move the economy back to potential GDP? LRAS SRAS SRAS O A. Increase the money supply. B. Increase government spending or decrease taxes. O C. Decrease government spending or increase taxes. O D. Both A and B. Price level 1.) Use the line drawing...
The potential GDP line is a ________ on the Keynesian Cross diagram which indicates GDP at...
The potential GDP line is a ________ on the Keynesian Cross diagram which indicates GDP at its potential on the horizontal axis. vertical line horizontal line sloping upward line The pure Keynesian AD-AS model assumes that for any level of GDP below potential, any change in AD affects real GDP, but NOT the ________. price level output level spending level Suppose an economy is defined by the following: C = 136 + 0.9 (Yd). The (Yd) in this algebraic equation...
New LRAS, SRAS, and AD lines in the graph for the next year: Price level The...
 New LRAS, SRAS, and AD lines in the graph for the next
year:
Price level The following graph shows an economy in long-run macroeconomic equilibrium. All the usual assumptions of the dynamic demand and supply model hold Firms and workers expect there to be a decline in the inflation rate in the coming year LRAS, SRAS Use the line tool to draw three lines 1) the new LRAS, 2) the new SRAS, and 3) the new AD line in the...
New LRAS, SRAS, and AD lines in the graph for the next
year:
Price level The following graph shows an economy in long-run macroeconomic equilibrium. All the usual assumptions of the dynamic demand and supply model hold Firms and workers expect there to be a decline in the inflation rate in the coming year LRAS, SRAS Use the line tool to draw three lines 1) the new LRAS, 2) the new SRAS, and 3) the new AD line in the...
10 The following graph shows aggregate demand and short run aggregate supply 1.) Use the line...
 10 The following graph shows aggregate demand and short run aggregate supply 1.) Use the line drawing tool to show the effect of an unexpected decrease in the price of oil. Property label this line. 2.) Use the point drawing tool to show the new equilibrium price level and real GDP. Label this point 'B'. Caretaly follow the instructions above, and only draw the required objects. LRAS, SRA Prevel A "ADO Re GOPY
[Related to the Solved Problem in this section] Consider the following information on an economy (all...
 [Related to the Solved Problem in this section] Consider the following information on an economy (all values are in trillions of 2005 dollars): Consumption: Investment Government purchases: Net exports Taxes: Government transfer payments: C = $1.2 + 0.67 1 = $2 G = $2.1 NX = - $0.5 T = 0 TR = 0 a. This economy's equilibrium real GDP is $ 12 trillion. (Enter your response as an integer.) b. Now suppose that all the information given in part...
This Question: 1 pt 11 of 30 This In the graph on the right the economy...
 This Question: 1 pt 11 of 30 This In the graph on the right the economy is in long-run equilibrium at point A Now, assume that there is an unexpected increase in the price of oil. 1) Use the line drawing tool to show the resulting short-run equilibrium on your diagram. Label any new aggregate demand or aggregate supply curve as AD, SRAS, LRAS, p riate 2.) Use the point drawing tool to locate the new short run equilibrium point...
The economy of Southland is currently in a macroeconomic equilibrium depicted by point on the graph...
 The economy of Southland is currently in a macroeconomic equilibrium depicted by point on the graph to the Suppose that the level of investment expenditures increases by 5500 and the multiplier is 2. The multiplier is ent from the simple multiplier, which assumes a horizontal AS curve d 1. Use the three-point curve drawing tool to draw and label a new AD curve that shows this AD shock Use the multipler ol 2 10 calculate the exact location of the...
The figure to the right shows an economy in an initial long-run equilibrium at point A...
 The figure to the right shows an economy in an initial long-run equilibrium at point A a Using the line drawing tool show how, if at all the equilibrium real GDP and the long run equilibrium price level are affected by a decrease in the value of the home currency in terms of the currencies of other nations Properly label this line Carefully follow the instructions above and only draw the required objects b. According to your graph, the equilibrium...
Figure: Aggregate Expenditures Curve III 3. Aggregate expenditures (per year) 45-degree line AE $800 $3.200 Real GDP (per year) . (Figure: Aggregate Expenditures Curve IlI) According to the figur...
 Figure: Aggregate Expenditures Curve III 3. Aggregate expenditures (per year) 45-degree line AE $800 $3.200 Real GDP (per year) . (Figure: Aggregate Expenditures Curve IlI) According to the figure Aggregate Expenditures Curve III, suppose that the economy is at the equilibrium real GDP of $3,200. Suppose that the consumption function in this figure rises by $100. What will the new equilibrium real GDP be? Show your work.
Figure: Aggregate Expenditures Curve III 3. Aggregate expenditures (per year) 45-degree line AE...
Figure: Aggregate Expenditures Curve III 3. Aggregate expenditures (per year) 45-degree line AE $800 $3.200 Real GDP (per year) . (Figure: Aggregate Expenditures Curve IlI) According to the figure Aggregate Expenditures Curve III, suppose that the economy is at the equilibrium real GDP of $3,200. Suppose that the consumption function in this figure rises by $100. What will the new equilibrium real GDP be? Show your work.
Figure: Aggregate Expenditures Curve III 3. Aggregate expenditures (per year) 45-degree line AE...
 please do all questions correctly
do the graph as well please
Refer to the diagram to the right. Initially, the aggregate expenditure curve is given by the following equation AE = 400 +0.60Y 2,000 1,800 The equilibrium level of income in this economy is equal to $ . (Round your response to the nearest dollar.) 1,60% 1,400 Suppose that the level of autonomous investment expenditures in this economy decreases by $200. esired Aggregate Expenditure 1. Use the line drawing tool...
please do all questions correctly
do the graph as well please
Refer to the diagram to the right. Initially, the aggregate expenditure curve is given by the following equation AE = 400 +0.60Y 2,000 1,800 The equilibrium level of income in this economy is equal to $ . (Round your response to the nearest dollar.) 1,60% 1,400 Suppose that the level of autonomous investment expenditures in this economy decreases by $200. esired Aggregate Expenditure 1. Use the line drawing tool...
 The graph to the right shows a situation in which the economy was in equilibrium at potential GDP (at point A) when the demand for housing sharply declined. What actions can the federal government take to move the economy back to potential GDP? LRAS SRAS SRAS O A. Increase the money supply. B. Increase government spending or decrease taxes. O C. Decrease government spending or increase taxes. O D. Both A and B. Price level 1.) Use the line drawing...
 New LRAS, SRAS, and AD lines in the graph for the next
year:
Price level The following graph shows an economy in long-run macroeconomic equilibrium. All the usual assumptions of the dynamic demand and supply model hold Firms and workers expect there to be a decline in the inflation rate in the coming year LRAS, SRAS Use the line tool to draw three lines 1) the new LRAS, 2) the new SRAS, and 3) the new AD line in the...
New LRAS, SRAS, and AD lines in the graph for the next
year:
Price level The following graph shows an economy in long-run macroeconomic equilibrium. All the usual assumptions of the dynamic demand and supply model hold Firms and workers expect there to be a decline in the inflation rate in the coming year LRAS, SRAS Use the line tool to draw three lines 1) the new LRAS, 2) the new SRAS, and 3) the new AD line in the...
 10 The following graph shows aggregate demand and short run aggregate supply 1.) Use the line drawing tool to show the effect of an unexpected decrease in the price of oil. Property label this line. 2.) Use the point drawing tool to show the new equilibrium price level and real GDP. Label this point 'B'. Caretaly follow the instructions above, and only draw the required objects. LRAS, SRA Prevel A "ADO Re GOPY
 [Related to the Solved Problem in this section] Consider the following information on an economy (all values are in trillions of 2005 dollars): Consumption: Investment Government purchases: Net exports Taxes: Government transfer payments: C = $1.2 + 0.67 1 = $2 G = $2.1 NX = - $0.5 T = 0 TR = 0 a. This economy's equilibrium real GDP is $ 12 trillion. (Enter your response as an integer.) b. Now suppose that all the information given in part...
 This Question: 1 pt 11 of 30 This In the graph on the right the economy is in long-run equilibrium at point A Now, assume that there is an unexpected increase in the price of oil. 1) Use the line drawing tool to show the resulting short-run equilibrium on your diagram. Label any new aggregate demand or aggregate supply curve as AD, SRAS, LRAS, p riate 2.) Use the point drawing tool to locate the new short run equilibrium point...
 The economy of Southland is currently in a macroeconomic equilibrium depicted by point on the graph to the Suppose that the level of investment expenditures increases by 5500 and the multiplier is 2. The multiplier is ent from the simple multiplier, which assumes a horizontal AS curve d 1. Use the three-point curve drawing tool to draw and label a new AD curve that shows this AD shock Use the multipler ol 2 10 calculate the exact location of the...
 The figure to the right shows an economy in an initial long-run equilibrium at point A a Using the line drawing tool show how, if at all the equilibrium real GDP and the long run equilibrium price level are affected by a decrease in the value of the home currency in terms of the currencies of other nations Properly label this line Carefully follow the instructions above and only draw the required objects b. According to your graph, the equilibrium...
 Figure: Aggregate Expenditures Curve III 3. Aggregate expenditures (per year) 45-degree line AE $800 $3.200 Real GDP (per year) . (Figure: Aggregate Expenditures Curve IlI) According to the figure Aggregate Expenditures Curve III, suppose that the economy is at the equilibrium real GDP of $3,200. Suppose that the consumption function in this figure rises by $100. What will the new equilibrium real GDP be? Show your work.
Figure: Aggregate Expenditures Curve III 3. Aggregate expenditures (per year) 45-degree line AE...
Figure: Aggregate Expenditures Curve III 3. Aggregate expenditures (per year) 45-degree line AE $800 $3.200 Real GDP (per year) . (Figure: Aggregate Expenditures Curve IlI) According to the figure Aggregate Expenditures Curve III, suppose that the economy is at the equilibrium real GDP of $3,200. Suppose that the consumption function in this figure rises by $100. What will the new equilibrium real GDP be? Show your work.
Figure: Aggregate Expenditures Curve III 3. Aggregate expenditures (per year) 45-degree line AE...
Most questions answered within 3 hours.
-
Where is the error in this code sequence?
String s1 = "Hello";
String s2 = "ello";...
asked 11 months ago -
Financial data for Joel de Paris, Inc., for last year
follow:
Joel de Paris, Inc.
Balance...
asked 11 months ago -
Consider this reaction:
Al2(SO4)3 (aq)+ BaCl3
(aq) Al2Cl6 (aq)- +
3BaSO4(s) . What is the...
asked 11 months ago -
Suppose that Savneet is considering increasing her
recent random sample from 20 car rentals to 40...
asked 11 months ago -
Trucks arrive at an unloading terminal at an average rate of 120
per hour.
Trucks arrive...
asked 11 months ago -
Why are methanol and ethanol completely soluble in water while
octanol is not very little soluble....
asked 11 months ago -
A facilities manager at a university reads in a research report
that the mean amount of...
asked 11 months ago -
When the CuSO4 is rehydrated by adding water to the anhydrous
compound, is this an endothermic...
asked 11 months ago -
A ray of sunlight is passing from diamond into crown glass; the
angle of incidence is...
asked 11 months ago -
A block of mass 0.249 kg is placed on top of a light, vertical
spring of...
asked 11 months ago -
how do the kidneys compensate in the presences of acidosis
a) trigger hyperventilate
b) reserve acid...
asked 11 months ago -
Question 501 pts
The rental rate of capital to the firm increases. Which of the
following...
asked 11 months ago