label the peaks of of the spectra with the corresponding
functional groups that you used to determine the structure make
writing legible please thank you 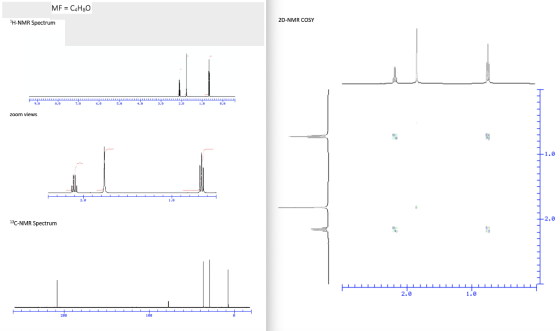
Homework Answers

Add Answer to:
label the peaks of of the spectra with the corresponding
functional groups that you used to...
Identify all major functional groups in the IR spectra Identify all peaks in 1H- and isC-NMR...
 Identify all major functional groups in the IR spectra Identify all peaks in 1H- and isC-NMR spectra. Identify the molecular mass of the unknown from the mass spectrum Determine the pattern of fragmentation from the mass spectrum Generate a molecular formula Determine the Index of Hydrogen Deficiency Determine the structure of the unknown compound.
thank you in advance Label the significant peaks in the IR and NMR spectra. When analyzing...
 thank you in advance
Label the significant peaks in the IR and NMR spectra. When analyzing the signals in the 'H NMR, be sure to include all appropriate information. For example: 3H, singlet, 0 neighbors, and c (the letter referring to the corresponding unique type of hydrogens that were labeled in the structure). It is recommended to provide more analysis for each signal than what is described above, when necessary, such as labeling any coupling constants if any are provided....
thank you in advance
Label the significant peaks in the IR and NMR spectra. When analyzing the signals in the 'H NMR, be sure to include all appropriate information. For example: 3H, singlet, 0 neighbors, and c (the letter referring to the corresponding unique type of hydrogens that were labeled in the structure). It is recommended to provide more analysis for each signal than what is described above, when necessary, such as labeling any coupling constants if any are provided....
Label the IR spectrum for functional groups and identify the correct structure of the compound. Indicate...
 Label the IR spectrum for functional groups and identify the
correct structure of the compound. Indicate the peaks on the H1-NMR
to show carbon connectivity and splitting pattern. Calculate the
degree of unsaturation. Draw the correct structure of the compound.
2) Mol wt: 148 g/mol IR spectrum: H1-NMR: 5 H 10 11 ppm 2H 2.H
Label the IR spectrum for functional groups and identify the
correct structure of the compound. Indicate the peaks on the H1-NMR
to show carbon connectivity and splitting pattern. Calculate the
degree of unsaturation. Draw the correct structure of the compound.
2) Mol wt: 148 g/mol IR spectrum: H1-NMR: 5 H 10 11 ppm 2H 2.H
Label the significant peaks in the IR and NMR spectra. When analyzing the signals in the 'HNMR, b...
 Label the significant peaks in the IR and NMR spectra. When analyzing the signals in the 'HNMR, be sure to include all appropriate information. For example: 3H, singlet, 0 neighbors, and c (the letter referring to the corresponding unique type of hydrogens that were labeled in the structure). It is recommended to provide more analysis for each signal than what is described above, when necessary, such as labeling any coupling constants if any are provided For NMR label each peak...
4. The proton NMR and IR spectra of Compound B are shown on the next page....
 4. The proton NMR and IR spectra of Compound B are shown on the next page. Using the molecular formula C,H,O: (a) Calculate the index of unsaturation. (b) Assign at least three absorption bands in the IR spectrum to functional groups. (C) By considering this value in your analysis of the spectra, give the correct structure for unknown B. Integration values are given above the peaks. (d) Label all peaks in the NMR spectrum, i.e., Ha, Hb, etc., and place...
Label NMR spectra. Label Functional groups: Esters- ethyl acetate # of unique H environment local chemical...
 Label NMR spectra.
Label
Functional groups: Esters- ethyl acetate
# of unique H environment
local chemical environment
# of H in each environment
# of neighboring protons
'H NMR Spectrum in CDCI; -2.289 L2.195 TTTTTTTTTTTTTTTTTTTTTTTTT 2.8 2.6 2.4 2.2 2.0 1.6 1.6 1.4 1.2 1.6 0.8 0.6 0.4 ppm 26.07 38.09 35.84 -0.806 -0.830 0.781 -.4 1.2 1.0 0.8 0.6 0.4 ppm 35.84 2.243 2.219 - -2.269 22.195 2.6 4 .4 2.2 2.0 1.8 1.6 26.07 1.4 38.09
Label NMR spectra.
Label
Functional groups: Esters- ethyl acetate
# of unique H environment
local chemical environment
# of H in each environment
# of neighboring protons
'H NMR Spectrum in CDCI; -2.289 L2.195 TTTTTTTTTTTTTTTTTTTTTTTTT 2.8 2.6 2.4 2.2 2.0 1.6 1.6 1.4 1.2 1.6 0.8 0.6 0.4 ppm 26.07 38.09 35.84 -0.806 -0.830 0.781 -.4 1.2 1.0 0.8 0.6 0.4 ppm 35.84 2.243 2.219 - -2.269 22.195 2.6 4 .4 2.2 2.0 1.8 1.6 26.07 1.4 38.09
Spectroscopy of C5H10O 1. Correctly label 2 peaks in the IR spectrum with the appropriate functional...
 Spectroscopy of C5H10O
1. Correctly label 2 peaks in the IR spectrum with the appropriate functional group. 2. Correctly label 1 peak in the 13C NMR spectrum. 3. Draw some possible structures (isomers) as you analyze the 'H NMR spectrum. 4. Draw your final choice of structure to match the IR. 13C NMR, and H NMR 5. Label the different types of hydrogens on your structure as a, b, c, etc. Label the peaks in the 'H NMR spectrum with...
Spectroscopy of C5H10O
1. Correctly label 2 peaks in the IR spectrum with the appropriate functional group. 2. Correctly label 1 peak in the 13C NMR spectrum. 3. Draw some possible structures (isomers) as you analyze the 'H NMR spectrum. 4. Draw your final choice of structure to match the IR. 13C NMR, and H NMR 5. Label the different types of hydrogens on your structure as a, b, c, etc. Label the peaks in the 'H NMR spectrum with...
Assign all peaks (or groups of peaks) in the following spectra. 13. Propose a structure for...
 Assign all peaks (or groups of peaks) in the following
spectra.
13. Propose a structure for the compound C.H.NO, with the following 'H NMR. 13C NMR and IR spectral data. 6H зн 200 150 160 160 120 0 0 0 20 0 100 am
Assign all peaks (or groups of peaks) in the following
spectra.
13. Propose a structure for the compound C.H.NO, with the following 'H NMR. 13C NMR and IR spectral data. 6H зн 200 150 160 160 120 0 0 0 20 0 100 am
Label the absorbances and functional groups on the IR spectra for a product of the Suzuki...
 Label the absorbances and functional groups on the IR spectra
for a product of the Suzuki Coupling lab.
The product is . please labels functional
groups on and absorbances on IR. Also describes the PPM with H's
for each and tell whether singlet or triplet. Please label all the
graphs.
Label the Proton NMR and the Carbon NMR.
OCHS oor - biphenyl-4-yl-ethanone DOST TRANSMETTANCE 25 E 715 5 715 | 675 65 635 515 5 515 415 45 435 1...
Label the absorbances and functional groups on the IR spectra
for a product of the Suzuki Coupling lab.
The product is . please labels functional
groups on and absorbances on IR. Also describes the PPM with H's
for each and tell whether singlet or triplet. Please label all the
graphs.
Label the Proton NMR and the Carbon NMR.
OCHS oor - biphenyl-4-yl-ethanone DOST TRANSMETTANCE 25 E 715 5 715 | 675 65 635 515 5 515 415 45 435 1...
For part B also calculate degree of unsaturation and use the MS and 13CNMR spectra...
 For part B also calculate degree of
unsaturation and use the MS and 13CNMR spectra to identify the
molecule. Label the graphs with the information gained.
9. Identify the compound with give molecular formula that gives the IR and 'H NMR spectra shown. Label the IR peaks with the type of functional group. Draw the structure of the compound and label the signals on the structure using letters (a, b, c, etc.) then label the signals on the 'H...
For part B also calculate degree of
unsaturation and use the MS and 13CNMR spectra to identify the
molecule. Label the graphs with the information gained.
9. Identify the compound with give molecular formula that gives the IR and 'H NMR spectra shown. Label the IR peaks with the type of functional group. Draw the structure of the compound and label the signals on the structure using letters (a, b, c, etc.) then label the signals on the 'H...
 Identify all major functional groups in the IR spectra Identify all peaks in 1H- and isC-NMR spectra. Identify the molecular mass of the unknown from the mass spectrum Determine the pattern of fragmentation from the mass spectrum Generate a molecular formula Determine the Index of Hydrogen Deficiency Determine the structure of the unknown compound.
 thank you in advance
Label the significant peaks in the IR and NMR spectra. When analyzing the signals in the 'H NMR, be sure to include all appropriate information. For example: 3H, singlet, 0 neighbors, and c (the letter referring to the corresponding unique type of hydrogens that were labeled in the structure). It is recommended to provide more analysis for each signal than what is described above, when necessary, such as labeling any coupling constants if any are provided....
thank you in advance
Label the significant peaks in the IR and NMR spectra. When analyzing the signals in the 'H NMR, be sure to include all appropriate information. For example: 3H, singlet, 0 neighbors, and c (the letter referring to the corresponding unique type of hydrogens that were labeled in the structure). It is recommended to provide more analysis for each signal than what is described above, when necessary, such as labeling any coupling constants if any are provided....
 Label the IR spectrum for functional groups and identify the
correct structure of the compound. Indicate the peaks on the H1-NMR
to show carbon connectivity and splitting pattern. Calculate the
degree of unsaturation. Draw the correct structure of the compound.
2) Mol wt: 148 g/mol IR spectrum: H1-NMR: 5 H 10 11 ppm 2H 2.H
Label the IR spectrum for functional groups and identify the
correct structure of the compound. Indicate the peaks on the H1-NMR
to show carbon connectivity and splitting pattern. Calculate the
degree of unsaturation. Draw the correct structure of the compound.
2) Mol wt: 148 g/mol IR spectrum: H1-NMR: 5 H 10 11 ppm 2H 2.H
 Label the significant peaks in the IR and NMR spectra. When analyzing the signals in the 'HNMR, be sure to include all appropriate information. For example: 3H, singlet, 0 neighbors, and c (the letter referring to the corresponding unique type of hydrogens that were labeled in the structure). It is recommended to provide more analysis for each signal than what is described above, when necessary, such as labeling any coupling constants if any are provided For NMR label each peak...
 4. The proton NMR and IR spectra of Compound B are shown on the next page. Using the molecular formula C,H,O: (a) Calculate the index of unsaturation. (b) Assign at least three absorption bands in the IR spectrum to functional groups. (C) By considering this value in your analysis of the spectra, give the correct structure for unknown B. Integration values are given above the peaks. (d) Label all peaks in the NMR spectrum, i.e., Ha, Hb, etc., and place...
 Label NMR spectra.
Label
Functional groups: Esters- ethyl acetate
# of unique H environment
local chemical environment
# of H in each environment
# of neighboring protons
'H NMR Spectrum in CDCI; -2.289 L2.195 TTTTTTTTTTTTTTTTTTTTTTTTT 2.8 2.6 2.4 2.2 2.0 1.6 1.6 1.4 1.2 1.6 0.8 0.6 0.4 ppm 26.07 38.09 35.84 -0.806 -0.830 0.781 -.4 1.2 1.0 0.8 0.6 0.4 ppm 35.84 2.243 2.219 - -2.269 22.195 2.6 4 .4 2.2 2.0 1.8 1.6 26.07 1.4 38.09
Label NMR spectra.
Label
Functional groups: Esters- ethyl acetate
# of unique H environment
local chemical environment
# of H in each environment
# of neighboring protons
'H NMR Spectrum in CDCI; -2.289 L2.195 TTTTTTTTTTTTTTTTTTTTTTTTT 2.8 2.6 2.4 2.2 2.0 1.6 1.6 1.4 1.2 1.6 0.8 0.6 0.4 ppm 26.07 38.09 35.84 -0.806 -0.830 0.781 -.4 1.2 1.0 0.8 0.6 0.4 ppm 35.84 2.243 2.219 - -2.269 22.195 2.6 4 .4 2.2 2.0 1.8 1.6 26.07 1.4 38.09
 Spectroscopy of C5H10O
1. Correctly label 2 peaks in the IR spectrum with the appropriate functional group. 2. Correctly label 1 peak in the 13C NMR spectrum. 3. Draw some possible structures (isomers) as you analyze the 'H NMR spectrum. 4. Draw your final choice of structure to match the IR. 13C NMR, and H NMR 5. Label the different types of hydrogens on your structure as a, b, c, etc. Label the peaks in the 'H NMR spectrum with...
Spectroscopy of C5H10O
1. Correctly label 2 peaks in the IR spectrum with the appropriate functional group. 2. Correctly label 1 peak in the 13C NMR spectrum. 3. Draw some possible structures (isomers) as you analyze the 'H NMR spectrum. 4. Draw your final choice of structure to match the IR. 13C NMR, and H NMR 5. Label the different types of hydrogens on your structure as a, b, c, etc. Label the peaks in the 'H NMR spectrum with...
 Assign all peaks (or groups of peaks) in the following
spectra.
13. Propose a structure for the compound C.H.NO, with the following 'H NMR. 13C NMR and IR spectral data. 6H зн 200 150 160 160 120 0 0 0 20 0 100 am
Assign all peaks (or groups of peaks) in the following
spectra.
13. Propose a structure for the compound C.H.NO, with the following 'H NMR. 13C NMR and IR spectral data. 6H зн 200 150 160 160 120 0 0 0 20 0 100 am
 Label the absorbances and functional groups on the IR spectra
for a product of the Suzuki Coupling lab.
The product is . please labels functional
groups on and absorbances on IR. Also describes the PPM with H's
for each and tell whether singlet or triplet. Please label all the
graphs.
Label the Proton NMR and the Carbon NMR.
OCHS oor - biphenyl-4-yl-ethanone DOST TRANSMETTANCE 25 E 715 5 715 | 675 65 635 515 5 515 415 45 435 1...
Label the absorbances and functional groups on the IR spectra
for a product of the Suzuki Coupling lab.
The product is . please labels functional
groups on and absorbances on IR. Also describes the PPM with H's
for each and tell whether singlet or triplet. Please label all the
graphs.
Label the Proton NMR and the Carbon NMR.
OCHS oor - biphenyl-4-yl-ethanone DOST TRANSMETTANCE 25 E 715 5 715 | 675 65 635 515 5 515 415 45 435 1...
 For part B also calculate degree of
unsaturation and use the MS and 13CNMR spectra to identify the
molecule. Label the graphs with the information gained.
9. Identify the compound with give molecular formula that gives the IR and 'H NMR spectra shown. Label the IR peaks with the type of functional group. Draw the structure of the compound and label the signals on the structure using letters (a, b, c, etc.) then label the signals on the 'H...
For part B also calculate degree of
unsaturation and use the MS and 13CNMR spectra to identify the
molecule. Label the graphs with the information gained.
9. Identify the compound with give molecular formula that gives the IR and 'H NMR spectra shown. Label the IR peaks with the type of functional group. Draw the structure of the compound and label the signals on the structure using letters (a, b, c, etc.) then label the signals on the 'H...
Most questions answered within 3 hours.
-
Where is the error in this code sequence?
String s1 = "Hello";
String s2 = "ello";...
asked 11 months ago -
Financial data for Joel de Paris, Inc., for last year
follow:
Joel de Paris, Inc.
Balance...
asked 11 months ago -
Consider this reaction:
Al2(SO4)3 (aq)+ BaCl3
(aq) Al2Cl6 (aq)- +
3BaSO4(s) . What is the...
asked 11 months ago -
Suppose that Savneet is considering increasing her
recent random sample from 20 car rentals to 40...
asked 11 months ago -
Trucks arrive at an unloading terminal at an average rate of 120
per hour.
Trucks arrive...
asked 11 months ago -
Why are methanol and ethanol completely soluble in water while
octanol is not very little soluble....
asked 11 months ago -
A facilities manager at a university reads in a research report
that the mean amount of...
asked 11 months ago -
When the CuSO4 is rehydrated by adding water to the anhydrous
compound, is this an endothermic...
asked 11 months ago -
A ray of sunlight is passing from diamond into crown glass; the
angle of incidence is...
asked 11 months ago -
A block of mass 0.249 kg is placed on top of a light, vertical
spring of...
asked 11 months ago -
how do the kidneys compensate in the presences of acidosis
a) trigger hyperventilate
b) reserve acid...
asked 11 months ago -
Question 501 pts
The rental rate of capital to the firm increases. Which of the
following...
asked 11 months ago