
Homework Answers

Add Answer to:
The following table lists 2012 GDP per capita for four countries. The data are given in...
It says one or more of my answers are wrong. The following table lists 2012 GDP...
 It says one or more of my answers are
wrong.
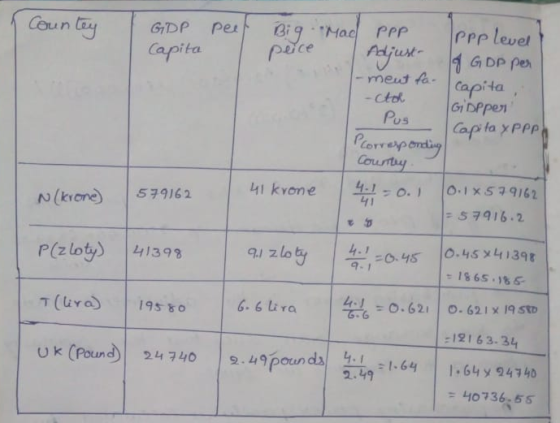
The following table lists 2012 GDP per capita for four countries. The data are given in the national currencies of the countries. It also lists the price of a Big Mac in local currency in each country in 2012. The price of a Big Mac in the United States in 2012 was $4.10. Using the Big Mac as a representative commodity common to the countries, calculate the purchasing power parity...
It says one or more of my answers are
wrong.
The following table lists 2012 GDP per capita for four countries. The data are given in the national currencies of the countries. It also lists the price of a Big Mac in local currency in each country in 2012. The price of a Big Mac in the United States in 2012 was $4.10. Using the Big Mac as a representative commodity common to the countries, calculate the purchasing power parity...
Suppose that when converting to the same currency values, the nominal GDP per capita in the...
 Suppose that when converting to the same currency values, the nominal GDP per capita in the fictional country of Islandia is 25 percent higher than the nominal GDP per capita in the fictional country of Mountainia. However, the purchasing power for the same amount of Islandia currency is about 40 percent lower in Islandia than in Mountainia. If we use Islandia as the base country for comparison, the PPP-adjusted GDP per capita in Mountainia i(Click to select) ts nominal GDP....
Many people use per capita GDP – GDP divided by the population in a country –...
Many people use per capita GDP – GDP divided by the population in a country – to compare the level of development and average living standards in countries. This is measured in dollars to make comparison possible. What is the difference between the nominal per capita GDP and PPP per capita GDP. If PPP per capita GDP is higher than the nominal number, does this imply that a country’s currency is over- or under-valued.
The following table lists gross domestic product (GDP) and approximate population for four countries in 2013....
 The following table lists gross domestic product (GDP) and approximate population for four countries in 2013. Note that GDP is given in millions of U.S dollars (USD). For example, a value of 16,800,000 suggests that U.S. GDP was approximately $16.8 trillion in 2013. GDP per capita, however, is simply given in dollars (USD) Calculate GDP per capita for each country and enter it in the fourth column of the table GDP per capita (USD) GDP France Liberia India United States...
8. Purchasing-power parity Using data from The Economist's Big Mac Index for 2016, the following table...
 8. Purchasing-power parity Using data from The Economist's Big Mac Index for 2016, the following table shows the local currency price of a Big Mac in several countries as well as the actual exchange rate between each country and the United States. At the time of the data collection, a Big Mac would have cost you $4.93 in the United States and GBP 2.89 in the United Kingdom. The actual exchange rate between the British pound and the U.S. dollar was...
8. Purchasing-power parity Using data from The Economist's Big Mac Index for 2016, the following ...
8. Purchasing-power parity Using data from The Economist's Big Mac Index for 2016, the following table shows the local currency price of a Big Mac in several countries as well as the actual exchange rate between each country and the United States. At the time of the data collection, a Big Mac would have cost you $4.93 in the United States and GBP 2.89 in the United Kingdom. The actual exchange rate between the British pound and the U.S. dollar...
Using data from The Economist's Big Mac Index for 2016, the following table shows the local...
 Using data from The Economist's Big Mac Index for 2016, the following table shows the local currency price of a Big Mac in several countries as well as the actual exchange rate between each country and the United States. At the time of the data collection, a Big Mac would have cost you $4.93 in the United States and GBP 2.89 in the United Kingdom. The actual exchange rate between the British pound and the U.S. dollar was $1.63 per...
8. Purchasing-power parity Using data from The Economist's Big Mac Index for 2016, the following table...
 8. Purchasing-power parity
Using data from The Economist's Big Mac Index for 2016,
the following table shows the local currency price of a Big Mac in
several countries as well as the actual exchange rate between each
country and the United States. At the time of the data collection,
a Big Mac would have cost you $4.93 in the United States and GBP
2.89 in the United Kingdom. The actual exchange rate between the
British pound and the U.S. dollar...
8. Purchasing-power parity
Using data from The Economist's Big Mac Index for 2016,
the following table shows the local currency price of a Big Mac in
several countries as well as the actual exchange rate between each
country and the United States. At the time of the data collection,
a Big Mac would have cost you $4.93 in the United States and GBP
2.89 in the United Kingdom. The actual exchange rate between the
British pound and the U.S. dollar...
6. Purchasing power parity Using data from The Economist's Big Mac Index for 2011, the following...
6. Purchasing power parity Using data from The Economist's Big Mac Index for 2011, the following table shows the local currency price of a Big Mac in several countries as well as the actual exchange rate between each country and the United States. At the time of the data collection, a Big Mac would have cost you $4.07 in the United States and GBP 2.39 in the United Kingdom. The actual exchange rate between the British pound and the U.S. dollar...
2. The following table lists GDP per capita from 1970 to 2010 for South Korea and...
 2. The following table lists GDP per capita from 1970 to 2010 for South Korea and the United States. As you can see, both grew substantially over that 40-year period Year South Korea GDP per Capita U.S. GDP per Capita 1970 1980 |1990 2000 2010 317 5247 1778 12598 6642 11948 22151 23955 36467 48358 [Data from the World Bank, World Development Indicators] a.Plot the five data points for each country on a graph using a nonproportional scale, as in...
 It says one or more of my answers are
wrong.
The following table lists 2012 GDP per capita for four countries. The data are given in the national currencies of the countries. It also lists the price of a Big Mac in local currency in each country in 2012. The price of a Big Mac in the United States in 2012 was $4.10. Using the Big Mac as a representative commodity common to the countries, calculate the purchasing power parity...
It says one or more of my answers are
wrong.
The following table lists 2012 GDP per capita for four countries. The data are given in the national currencies of the countries. It also lists the price of a Big Mac in local currency in each country in 2012. The price of a Big Mac in the United States in 2012 was $4.10. Using the Big Mac as a representative commodity common to the countries, calculate the purchasing power parity...
 Suppose that when converting to the same currency values, the nominal GDP per capita in the fictional country of Islandia is 25 percent higher than the nominal GDP per capita in the fictional country of Mountainia. However, the purchasing power for the same amount of Islandia currency is about 40 percent lower in Islandia than in Mountainia. If we use Islandia as the base country for comparison, the PPP-adjusted GDP per capita in Mountainia i(Click to select) ts nominal GDP....
 The following table lists gross domestic product (GDP) and approximate population for four countries in 2013. Note that GDP is given in millions of U.S dollars (USD). For example, a value of 16,800,000 suggests that U.S. GDP was approximately $16.8 trillion in 2013. GDP per capita, however, is simply given in dollars (USD) Calculate GDP per capita for each country and enter it in the fourth column of the table GDP per capita (USD) GDP France Liberia India United States...
 8. Purchasing-power parity Using data from The Economist's Big Mac Index for 2016, the following table shows the local currency price of a Big Mac in several countries as well as the actual exchange rate between each country and the United States. At the time of the data collection, a Big Mac would have cost you $4.93 in the United States and GBP 2.89 in the United Kingdom. The actual exchange rate between the British pound and the U.S. dollar was...
 Using data from The Economist's Big Mac Index for 2016, the following table shows the local currency price of a Big Mac in several countries as well as the actual exchange rate between each country and the United States. At the time of the data collection, a Big Mac would have cost you $4.93 in the United States and GBP 2.89 in the United Kingdom. The actual exchange rate between the British pound and the U.S. dollar was $1.63 per...
 8. Purchasing-power parity
Using data from The Economist's Big Mac Index for 2016,
the following table shows the local currency price of a Big Mac in
several countries as well as the actual exchange rate between each
country and the United States. At the time of the data collection,
a Big Mac would have cost you $4.93 in the United States and GBP
2.89 in the United Kingdom. The actual exchange rate between the
British pound and the U.S. dollar...
8. Purchasing-power parity
Using data from The Economist's Big Mac Index for 2016,
the following table shows the local currency price of a Big Mac in
several countries as well as the actual exchange rate between each
country and the United States. At the time of the data collection,
a Big Mac would have cost you $4.93 in the United States and GBP
2.89 in the United Kingdom. The actual exchange rate between the
British pound and the U.S. dollar...
 2. The following table lists GDP per capita from 1970 to 2010 for South Korea and the United States. As you can see, both grew substantially over that 40-year period Year South Korea GDP per Capita U.S. GDP per Capita 1970 1980 |1990 2000 2010 317 5247 1778 12598 6642 11948 22151 23955 36467 48358 [Data from the World Bank, World Development Indicators] a.Plot the five data points for each country on a graph using a nonproportional scale, as in...
Most questions answered within 3 hours.
-
Where is the error in this code sequence?
String s1 = "Hello";
String s2 = "ello";...
asked 10 months ago -
Financial data for Joel de Paris, Inc., for last year
follow:
Joel de Paris, Inc.
Balance...
asked 10 months ago -
Consider this reaction:
Al2(SO4)3 (aq)+ BaCl3
(aq) Al2Cl6 (aq)- +
3BaSO4(s) . What is the...
asked 10 months ago -
Suppose that Savneet is considering increasing her
recent random sample from 20 car rentals to 40...
asked 10 months ago -
Trucks arrive at an unloading terminal at an average rate of 120
per hour.
Trucks arrive...
asked 10 months ago -
Why are methanol and ethanol completely soluble in water while
octanol is not very little soluble....
asked 10 months ago -
A facilities manager at a university reads in a research report
that the mean amount of...
asked 10 months ago -
When the CuSO4 is rehydrated by adding water to the anhydrous
compound, is this an endothermic...
asked 10 months ago -
A ray of sunlight is passing from diamond into crown glass; the
angle of incidence is...
asked 10 months ago -
A block of mass 0.249 kg is placed on top of a light, vertical
spring of...
asked 10 months ago -
how do the kidneys compensate in the presences of acidosis
a) trigger hyperventilate
b) reserve acid...
asked 10 months ago -
Question 501 pts
The rental rate of capital to the firm increases. Which of the
following...
asked 10 months ago