

Homework Answers


Add Answer to:
Given the soil cylinder and the test setup shown in Figure 2 10 cm 5 cm...
6. (Bonus question) In the experimental setup shown in Figure 6, water flows through soils 1...
 6. (Bonus question) In the experimental setup shown in Figure 6, water flows through soils 1 and 2 upward under constant head. Assume c-c as the datum. (1) Find the total and pressure heads at c-c; (2) If the head loss after flowing through Soil 2 is 30% of the total head difference, determine the total and pressure heads at b-b; (3) Given the coefficient of permeability of Soil 2 as 0.05 cm/sec, determine the rate of discharge; (4) Calculate...
QUESTION 14 The experimental setup shown in the figure was designed to test which of the...
 QUESTION 14 The experimental setup shown in the figure was designed to test which of the following? Dictyostelium cells Light source Nutrient free agar Single-celled amoeba stage Slug Bacteria Soil O a. competition between slime mold slugs and amoebas Ob. the consumption of amoebas by slime mold slugs Oc. the reproductive ability of slime mold slugs and amoebas O d. the economy of scale of slime mold slugs and amoebas regarding efficiency of travel
QUESTION 14 The experimental setup shown...
QUESTION 14 The experimental setup shown in the figure was designed to test which of the following? Dictyostelium cells Light source Nutrient free agar Single-celled amoeba stage Slug Bacteria Soil O a. competition between slime mold slugs and amoebas Ob. the consumption of amoebas by slime mold slugs Oc. the reproductive ability of slime mold slugs and amoebas O d. the economy of scale of slime mold slugs and amoebas regarding efficiency of travel
QUESTION 14 The experimental setup shown...
)lethöd illustrated ered soil is shown in Figure 7.33. Given: , H 1.5 m k, 9...
 )lethöd illustrated ered soil is shown in Figure 7.33. Given: , H 1.5 m k, 9 x 10⁻⁴ cm/sec . H2 2.5 m k2 7.8 10-3 cm/sec H 3.5 m k3 -4.5 x 10⁻⁵ cm/sec stimate the ratio of equivalent permeability, k #Heg/kv(eq). in Figure Figure 7.33
h 10 cm Consider a large cylinder of ice, Pice shown in the figure. 920 k9/,.3,...
 h 10 cm Consider a large cylinder of ice, Pice shown in the figure. 920 k9/,.3, floating on seawater, Pvater 1000 k9/ as 3, as If a 10 cm portion of the ice extends above the water, what is the height of the ice below the surface, H? (5 points) What is the distance CG from the center of mass of the ice cylinder to the centroid of displaced volume? (5 points) a. b. c. In terms of the diameter,...
(4). (8 pts). A soil profile is shown in below Figure. A uniformly distributed load Ao is applied at the surface of soil. Given the preconsolidation pressure is between swell index and compressio...
 (4). (8 pts). A soil profile is shown in below Figure. A uniformly distributed load Ao is applied at the surface of soil. Given the preconsolidation pressure is between swell index and compression index is: C C/6. The unit weight of water is: -9.38 kN/m. If U-98% we regard it as a completion of primary consolidation. We have taken the clay sample and done the Atterberg Limit test. For the liquid limit test, the result is as below. Please ơ'-926...
Homework #10 A soil exploration result of a site is shown in the following figure. A...
 Homework #10 A soil exploration result of a site is shown in the following figure. A building is to be constructed at that site. First, it has been proposed to raise the elevation of the ground by filling the site with 10 ft thick compacted soil at an area of 25 ft x 25 ft. The unit weight of the compacted moist soil was 120 pcf. The foundation of proposed building was constructed at the center of the compaction area...
A permeable soil layer is underlain by an impervious layer, as shown in the figure. With...
 A permeable soil layer is underlain by an impervious layer, as shown in the figure. With k = 5.2 x 10⁻⁴ cm/s for the permeable layer, calculate the rate of seepage through it in m/hr/m length. Given: H 3.8 m and a - 58 Ground surface Groundwater table (free surface
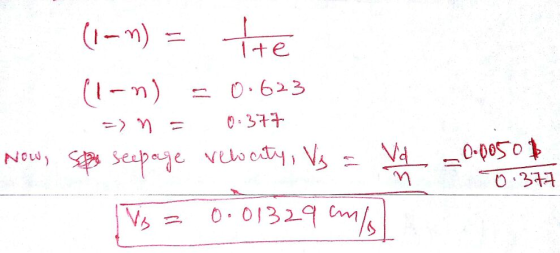
For the two cases shown compute: a) hydraulic gradient, b) true seepage velocity (in cm/s), and...
 For the two cases shown compute: a) hydraulic gradient, b) true seepage velocity (in cm/s), and c) discharge or Darcy's velocity (in cm/s) if the soil permeability is 5 x 10 cm/s. 8 ( n=0.3 Elevation (ft) Datum
A constant-head flow experiment is set up as shown. The soil is a saturated cylindrical silty...
 A constant-head flow experiment is set
up as shown. The soil is a saturated cylindrical silty sand sample
extending between Points B and D. Hydraulic conductivity of the
sand is k = 1 x 10⁻³ cm/sec.
Using the datum shown, calculate the elevation head
he (cm), pressure head hp (cm), and total
head ht (cm) at Points A, B, C, D and E. Report your
answers in the table provided.
Calculate the flow (in cm3/hr) through the silty
sand assuming...
A constant-head flow experiment is set
up as shown. The soil is a saturated cylindrical silty sand sample
extending between Points B and D. Hydraulic conductivity of the
sand is k = 1 x 10⁻³ cm/sec.
Using the datum shown, calculate the elevation head
he (cm), pressure head hp (cm), and total
head ht (cm) at Points A, B, C, D and E. Report your
answers in the table provided.
Calculate the flow (in cm3/hr) through the silty
sand assuming...
Question 1: 10 marks Consider the raft foundation shown in Figure Q1 Dense soil ? 320...
 Question 1: 10 marks Consider the raft foundation shown in Figure Q1 Dense soil ? 320 Raft Foundation q-700kPa 2m 8m Dense soil ?=32° c-0 Ysai 18kN/m Plan Section Figure Q1 Compute: i. Change in Stress in the centre of raft at a depth of 5m from ground. ii. Allowable Bearing capacity. 5 marks] [5 marks] 10 marks Question 2
 6. (Bonus question) In the experimental setup shown in Figure 6, water flows through soils 1 and 2 upward under constant head. Assume c-c as the datum. (1) Find the total and pressure heads at c-c; (2) If the head loss after flowing through Soil 2 is 30% of the total head difference, determine the total and pressure heads at b-b; (3) Given the coefficient of permeability of Soil 2 as 0.05 cm/sec, determine the rate of discharge; (4) Calculate...
 QUESTION 14 The experimental setup shown in the figure was designed to test which of the following? Dictyostelium cells Light source Nutrient free agar Single-celled amoeba stage Slug Bacteria Soil O a. competition between slime mold slugs and amoebas Ob. the consumption of amoebas by slime mold slugs Oc. the reproductive ability of slime mold slugs and amoebas O d. the economy of scale of slime mold slugs and amoebas regarding efficiency of travel
QUESTION 14 The experimental setup shown...
QUESTION 14 The experimental setup shown in the figure was designed to test which of the following? Dictyostelium cells Light source Nutrient free agar Single-celled amoeba stage Slug Bacteria Soil O a. competition between slime mold slugs and amoebas Ob. the consumption of amoebas by slime mold slugs Oc. the reproductive ability of slime mold slugs and amoebas O d. the economy of scale of slime mold slugs and amoebas regarding efficiency of travel
QUESTION 14 The experimental setup shown...
 )lethöd illustrated ered soil is shown in Figure 7.33. Given: , H 1.5 m k, 9 x 10⁻⁴ cm/sec . H2 2.5 m k2 7.8 10-3 cm/sec H 3.5 m k3 -4.5 x 10⁻⁵ cm/sec stimate the ratio of equivalent permeability, k #Heg/kv(eq). in Figure Figure 7.33
 h 10 cm Consider a large cylinder of ice, Pice shown in the figure. 920 k9/,.3, floating on seawater, Pvater 1000 k9/ as 3, as If a 10 cm portion of the ice extends above the water, what is the height of the ice below the surface, H? (5 points) What is the distance CG from the center of mass of the ice cylinder to the centroid of displaced volume? (5 points) a. b. c. In terms of the diameter,...
 (4). (8 pts). A soil profile is shown in below Figure. A uniformly distributed load Ao is applied at the surface of soil. Given the preconsolidation pressure is between swell index and compression index is: C C/6. The unit weight of water is: -9.38 kN/m. If U-98% we regard it as a completion of primary consolidation. We have taken the clay sample and done the Atterberg Limit test. For the liquid limit test, the result is as below. Please ơ'-926...
 Homework #10 A soil exploration result of a site is shown in the following figure. A building is to be constructed at that site. First, it has been proposed to raise the elevation of the ground by filling the site with 10 ft thick compacted soil at an area of 25 ft x 25 ft. The unit weight of the compacted moist soil was 120 pcf. The foundation of proposed building was constructed at the center of the compaction area...
 A permeable soil layer is underlain by an impervious layer, as shown in the figure. With k = 5.2 x 10⁻⁴ cm/s for the permeable layer, calculate the rate of seepage through it in m/hr/m length. Given: H 3.8 m and a - 58 Ground surface Groundwater table (free surface
 For the two cases shown compute: a) hydraulic gradient, b) true seepage velocity (in cm/s), and c) discharge or Darcy's velocity (in cm/s) if the soil permeability is 5 x 10 cm/s. 8 ( n=0.3 Elevation (ft) Datum
 A constant-head flow experiment is set
up as shown. The soil is a saturated cylindrical silty sand sample
extending between Points B and D. Hydraulic conductivity of the
sand is k = 1 x 10⁻³ cm/sec.
Using the datum shown, calculate the elevation head
he (cm), pressure head hp (cm), and total
head ht (cm) at Points A, B, C, D and E. Report your
answers in the table provided.
Calculate the flow (in cm3/hr) through the silty
sand assuming...
A constant-head flow experiment is set
up as shown. The soil is a saturated cylindrical silty sand sample
extending between Points B and D. Hydraulic conductivity of the
sand is k = 1 x 10⁻³ cm/sec.
Using the datum shown, calculate the elevation head
he (cm), pressure head hp (cm), and total
head ht (cm) at Points A, B, C, D and E. Report your
answers in the table provided.
Calculate the flow (in cm3/hr) through the silty
sand assuming...
 Question 1: 10 marks Consider the raft foundation shown in Figure Q1 Dense soil ? 320 Raft Foundation q-700kPa 2m 8m Dense soil ?=32° c-0 Ysai 18kN/m Plan Section Figure Q1 Compute: i. Change in Stress in the centre of raft at a depth of 5m from ground. ii. Allowable Bearing capacity. 5 marks] [5 marks] 10 marks Question 2
Most questions answered within 3 hours.
-
Where is the error in this code sequence?
String s1 = "Hello";
String s2 = "ello";...
asked 11 months ago -
Financial data for Joel de Paris, Inc., for last year
follow:
Joel de Paris, Inc.
Balance...
asked 11 months ago -
Consider this reaction:
Al2(SO4)3 (aq)+ BaCl3
(aq) Al2Cl6 (aq)- +
3BaSO4(s) . What is the...
asked 11 months ago -
Suppose that Savneet is considering increasing her
recent random sample from 20 car rentals to 40...
asked 11 months ago -
Trucks arrive at an unloading terminal at an average rate of 120
per hour.
Trucks arrive...
asked 11 months ago -
Why are methanol and ethanol completely soluble in water while
octanol is not very little soluble....
asked 11 months ago -
A facilities manager at a university reads in a research report
that the mean amount of...
asked 11 months ago -
When the CuSO4 is rehydrated by adding water to the anhydrous
compound, is this an endothermic...
asked 11 months ago -
A ray of sunlight is passing from diamond into crown glass; the
angle of incidence is...
asked 11 months ago -
A block of mass 0.249 kg is placed on top of a light, vertical
spring of...
asked 11 months ago -
how do the kidneys compensate in the presences of acidosis
a) trigger hyperventilate
b) reserve acid...
asked 11 months ago -
Question 501 pts
The rental rate of capital to the firm increases. Which of the
following...
asked 11 months ago