
Homework Answers
Add Answer to:
11/30/2019 18. A certain type of candy is reported to be distributed with the color percentages...
1/30/2019 18. A certain type of candy is reported to be distributed with the color percentages...
 1/30/2019 18. A certain type of candy is reported to be distributed with the color percentages shown in the table below. The number of each color in a random bag of candy is also shown below. Use the chi-square goodness-of-fit test to decide whether the color distribution differs from the reported distribution. Use a = 0.05. Red Brown Blue 12 14 Color Percentage Frequency Green 17 Orange Yellow 1915 238 23 30 156 22 Determine the null and alternative hypotheses....
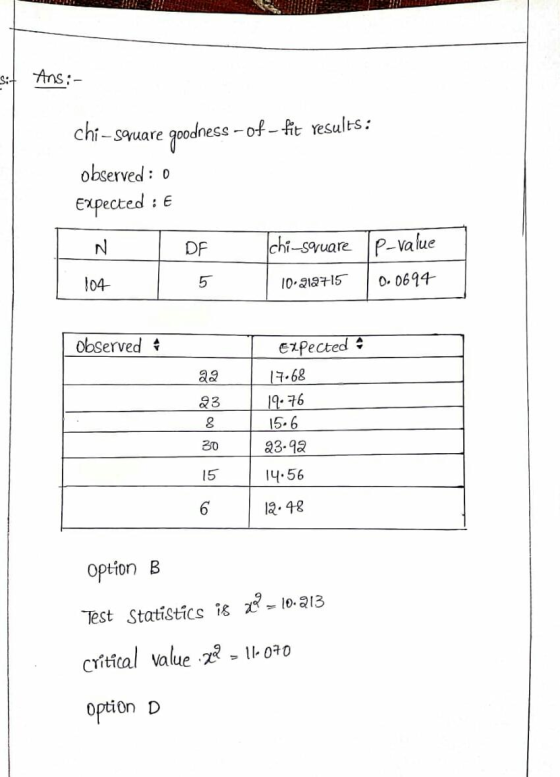
Consider the following discrete probability distribution along with observed frequencies for each day of the week....
Consider the following discrete probability distribution along with observed frequencies for each day of the week. Complete parts a and b below. Weekday Monday Tuesday Wednesday Thursday Friday Total Probability 0.10 0.20 0.05 0.30 0.35 1.00 Observed Frequency, f Subscript o 12 26 9 39 44 130 a. Perform a chi-square test using alphaequals0.05 to determine if the observed frequencies follow a discrete probability distribution. Determine the null and alternative hypotheses. Choose the correct answer below. A. Upper H 0:...
A distribution and the observed frequencies of the values of a variable from a simple random sample of the population are provided below. Use the chi-square goodness-of-fit test to decide, at the spe...
 A distribution and the observed frequencies of the values of a variable from a simple random sample of the population are provided below. Use the chi-square goodness-of-fit test to decide, at the specified significance level, whether the distribution of the variable differs from the given distribution Distribution: 0.1875, 0.1875, Observed frequencies: 16, 20, 24, 36 Significance level 0.05 0.3125, 0.3125 Determine the null and alternative hypotheses. Choose the correct answer below. OA. H: The distribution of the variable differs from...
Conduct the hypothesis test and provide the test statistic, critical value and P-value, and state the conclusion A package of 100 candies are distributed with the following color percentages 13% r...
 Conduct the hypothesis test and provide the test statistic, critical value and P-value, and state the conclusion A package of 100 candies are distributed with the following color percentages 13% red 20% ora ge, 15% yellow 12% br dlaimed. Use a 0.10 significance level. EEB Click the icon to view the color counts for the candy in the package Click here fo view the chi-square distribution table, 25% blue and 15% g een Use the given sa ple data to...
In a previous poll, 36% of adults with children under the age of 18 reported that...
 In a previous poll, 36% of adults with children under the age of 18 reported that their family ate dinner together seven nights a week. Suppose that, in a more recent poll, 378 of 1108 adults with children under the age of 18 reported that their family ate dinner together seven nights a week. Is there sufficient evidence that the proportion of families with children under the age of 18 who eat dinner together seven nights a week has decreased?...
The true average diameter of ball bearings of a certain type is supposed to be 0.5...
 The true average diameter of ball bearings of a certain type is supposed to be 0.5 in. A one-sample t test will be carried out to see whether this is the case. What conclusion is appropriate in each of the following situations? (a) n 15 t 1.66 a 0.05 o Reject the null hypothesis. There is sufficient evidence that the true diameter differs from 0.5 in o Reject the null hypothesis. There is not sufficient evidence that the true diameter...
Conduct the hypothesis test and provide the test statistic, critical value and P-value, and state the conclusion. A package of 100 candies are distributed with the following color percentages: 12% ed...
 Conduct the hypothesis test and provide the test statistic, critical value and P-value, and state the conclusion. A package of 100 candies are distributed with the following color percentages: 12% ed, 22% orange, 15% yellow, 10% brown, 25% blue and 16% green. Use the given sample data to test the claim that the color distribution is as claimed. Use a 0.01 significance level 囲 Click the icon to view the color counts for the candy in the package. The test...
S The true average diameter of ball bearings of a certain type is supposed to be...
 S The true average diameter of ball bearings of a certain type is supposed to be 0.5 in. A one-sample t test will be carried out to see whether this is the case. What conclusion is appropriate in each of the following situations? (a) n =20,t = 1.59, a = 0.05 Reject the null hypothesis. There is sufficient evidence that the true diameter differs from 0.5 in O Reject the null hypothesis. There is not sufficient evidence that the true...
The true average diameter of ball bearings of a certain type is supposed to be 0.5...
The true average diameter of ball bearings of a certain type is supposed to be 0.5 in. A one-sample t test will be carried out to see whether this is the case. What conclusion is appropriate in each of the following situations? (a) n = 16, t = 1.59, α = 0.05 Reject the null hypothesis. There is sufficient evidence that the true diameter differs from 0.5 in. Reject the null hypothesis. There is not sufficient evidence that the true...
A random sample of size n= 15 obtained from a population that is normally distributed results...
 A random sample of size n= 15 obtained from a population that is normally distributed results in a sample mean of 45.8 and sample standard deviation 12.2. An independent sample of size n = 20 obtained from a population that is normally distributed results in a sample mean of 51.9 and sample standard deviation 14.6. Does this constitute sufficient evidence to conclude that the population means differ at the a = 0.05 level of significance? Click here to view the...
 1/30/2019 18. A certain type of candy is reported to be distributed with the color percentages shown in the table below. The number of each color in a random bag of candy is also shown below. Use the chi-square goodness-of-fit test to decide whether the color distribution differs from the reported distribution. Use a = 0.05. Red Brown Blue 12 14 Color Percentage Frequency Green 17 Orange Yellow 1915 238 23 30 156 22 Determine the null and alternative hypotheses....
 A distribution and the observed frequencies of the values of a variable from a simple random sample of the population are provided below. Use the chi-square goodness-of-fit test to decide, at the specified significance level, whether the distribution of the variable differs from the given distribution Distribution: 0.1875, 0.1875, Observed frequencies: 16, 20, 24, 36 Significance level 0.05 0.3125, 0.3125 Determine the null and alternative hypotheses. Choose the correct answer below. OA. H: The distribution of the variable differs from...
 Conduct the hypothesis test and provide the test statistic, critical value and P-value, and state the conclusion A package of 100 candies are distributed with the following color percentages 13% red 20% ora ge, 15% yellow 12% br dlaimed. Use a 0.10 significance level. EEB Click the icon to view the color counts for the candy in the package Click here fo view the chi-square distribution table, 25% blue and 15% g een Use the given sa ple data to...
 In a previous poll, 36% of adults with children under the age of 18 reported that their family ate dinner together seven nights a week. Suppose that, in a more recent poll, 378 of 1108 adults with children under the age of 18 reported that their family ate dinner together seven nights a week. Is there sufficient evidence that the proportion of families with children under the age of 18 who eat dinner together seven nights a week has decreased?...
 The true average diameter of ball bearings of a certain type is supposed to be 0.5 in. A one-sample t test will be carried out to see whether this is the case. What conclusion is appropriate in each of the following situations? (a) n 15 t 1.66 a 0.05 o Reject the null hypothesis. There is sufficient evidence that the true diameter differs from 0.5 in o Reject the null hypothesis. There is not sufficient evidence that the true diameter...
 Conduct the hypothesis test and provide the test statistic, critical value and P-value, and state the conclusion. A package of 100 candies are distributed with the following color percentages: 12% ed, 22% orange, 15% yellow, 10% brown, 25% blue and 16% green. Use the given sample data to test the claim that the color distribution is as claimed. Use a 0.01 significance level 囲 Click the icon to view the color counts for the candy in the package. The test...
 S The true average diameter of ball bearings of a certain type is supposed to be 0.5 in. A one-sample t test will be carried out to see whether this is the case. What conclusion is appropriate in each of the following situations? (a) n =20,t = 1.59, a = 0.05 Reject the null hypothesis. There is sufficient evidence that the true diameter differs from 0.5 in O Reject the null hypothesis. There is not sufficient evidence that the true...
 A random sample of size n= 15 obtained from a population that is normally distributed results in a sample mean of 45.8 and sample standard deviation 12.2. An independent sample of size n = 20 obtained from a population that is normally distributed results in a sample mean of 51.9 and sample standard deviation 14.6. Does this constitute sufficient evidence to conclude that the population means differ at the a = 0.05 level of significance? Click here to view the...
Most questions answered within 3 hours.
-
Where is the error in this code sequence?
String s1 = "Hello";
String s2 = "ello";...
asked 10 months ago -
Financial data for Joel de Paris, Inc., for last year
follow:
Joel de Paris, Inc.
Balance...
asked 10 months ago -
Consider this reaction:
Al2(SO4)3 (aq)+ BaCl3
(aq) Al2Cl6 (aq)- +
3BaSO4(s) . What is the...
asked 10 months ago -
Suppose that Savneet is considering increasing her
recent random sample from 20 car rentals to 40...
asked 10 months ago -
Trucks arrive at an unloading terminal at an average rate of 120
per hour.
Trucks arrive...
asked 10 months ago -
Why are methanol and ethanol completely soluble in water while
octanol is not very little soluble....
asked 10 months ago -
A facilities manager at a university reads in a research report
that the mean amount of...
asked 10 months ago -
When the CuSO4 is rehydrated by adding water to the anhydrous
compound, is this an endothermic...
asked 10 months ago -
A ray of sunlight is passing from diamond into crown glass; the
angle of incidence is...
asked 10 months ago -
A block of mass 0.249 kg is placed on top of a light, vertical
spring of...
asked 10 months ago -
how do the kidneys compensate in the presences of acidosis
a) trigger hyperventilate
b) reserve acid...
asked 10 months ago -
Question 501 pts
The rental rate of capital to the firm increases. Which of the
following...
asked 10 months ago