
Homework Answers
(a) When there is a health update of beef being a healthiest source of protein in contrast to beef being too high in fat to be a healthy source, the demand for beef increases from DEMAND to DEMAND1 as in the diagram below. On the other hand, when Canadian ranchers have increased their size of their herds in anticipation of selling more beef to both Canadian and foreign consumers, the supply of beef increases from SUPPLY to SUPPLY1.
When there is an increase in demand, the demand curve shifts to the right and when there is an increase in supply the supply curve shifts to the right. But, since the price has fallen at the end, we see that the demand has increased less compared to the increase in supply (if demand would have increased more than the supply, the price would have risen at the end).
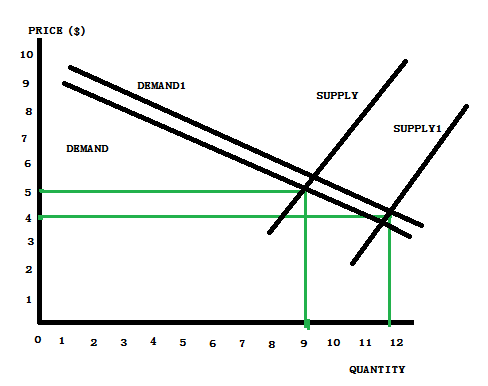
(b) With the types of the shocks that occurred in this hypothetical example, the effects on the price and quantity were unambiguous since compared to the original equilibrium that was specified since the demand has increased less than the increase in quantity. So, there was a price decrease and quantity increase.
Add Answer to:
3.3 Equilibriums - Simultaneous Shifts Question Consider the following hypothetical story on the Canadian beef market....
Question 2. Consider the market for burritos in a hypothetical Canadian city, blessed with thousands of...
Question 2. Consider the market for burritos in a hypothetical Canadian city, blessed with thousands of students and dozens of small burritos stands. The demand and supply schedules are shown in the table. Price ($) Quantity Demanded (Burritos) Quantity Supplied (Burritos) 0.0 500 125 1.0 400 175 1.50 350 200 2.00 300 225 2.50 250 250 3.00 200 275 3.50 150 300 4.00 100 325 5.00 0 375 a) Graph the demand and supply curves. What is the free -market...
Consider the market for leather. The following events occur simultaneously: 1. The price of beef rises(beef...
 Consider the market for leather. The following events occur
simultaneously:
1. The price of beef rises(beef and leather both come for
cows)
2. The price of alligator hides increases.
3. Consider the market for leather. The following events occur simultaneously: (i) (ii) The price of beef rises (beef and leather both come from cows). The price of alligator hides increases. Draw a demand-and-supply graph showing equilibrium in the market for leather before the two events described above. Label the axes...
Consider the market for leather. The following events occur
simultaneously:
1. The price of beef rises(beef and leather both come for
cows)
2. The price of alligator hides increases.
3. Consider the market for leather. The following events occur simultaneously: (i) (ii) The price of beef rises (beef and leather both come from cows). The price of alligator hides increases. Draw a demand-and-supply graph showing equilibrium in the market for leather before the two events described above. Label the axes...
Question 2. Consider the market for burritos in a hypothetical Canadian city, blessed with thousands of...
 Question 2. Consider the market for burritos in a hypothetical Canadian city, blessed with thousands of students and dozens of small burritos stands. The demand and supply schedules are shown in the table Price (S) Quantity Demanded (Burritos) Quantity Supplied (Burritos) 125 0.0 500 1.0 400 175 1.50 350 200 300 2.00 225 2.50 250 250 3.00 200 275 3.50 150 300 4.00 100 325 5.00 0 375 a) Graph the demand and supply curves. What is the free -market...
Question 2. Consider the market for burritos in a hypothetical Canadian city, blessed with thousands of students and...
Question 2. Consider the market for burritos in a hypothetical Canadian city, blessed with thousands of students and dozens of small burritos stands. The demand and supply schedules are shown in the table. Price ($) Quantity Demanded (Burritos) Quantity Supplied (Burritos) 0.0 500 125 1.0 400 175 1.50 350 200 2.00 300 225 2.50 250 250 3.00 200 275 3.50 150 300 4.00 100 325 5.00 0 375 a) Graph the demand and supply curves. What is the free -market...
 Consider the market for leather. The following events occur
simultaneously:
1. The price of beef rises(beef and leather both come for
cows)
2. The price of alligator hides increases.
3. Consider the market for leather. The following events occur simultaneously: (i) (ii) The price of beef rises (beef and leather both come from cows). The price of alligator hides increases. Draw a demand-and-supply graph showing equilibrium in the market for leather before the two events described above. Label the axes...
Consider the market for leather. The following events occur
simultaneously:
1. The price of beef rises(beef and leather both come for
cows)
2. The price of alligator hides increases.
3. Consider the market for leather. The following events occur simultaneously: (i) (ii) The price of beef rises (beef and leather both come from cows). The price of alligator hides increases. Draw a demand-and-supply graph showing equilibrium in the market for leather before the two events described above. Label the axes...
 Question 2. Consider the market for burritos in a hypothetical Canadian city, blessed with thousands of students and dozens of small burritos stands. The demand and supply schedules are shown in the table Price (S) Quantity Demanded (Burritos) Quantity Supplied (Burritos) 125 0.0 500 1.0 400 175 1.50 350 200 300 2.00 225 2.50 250 250 3.00 200 275 3.50 150 300 4.00 100 325 5.00 0 375 a) Graph the demand and supply curves. What is the free -market...
Most questions answered within 3 hours.
-
Where is the error in this code sequence?
String s1 = "Hello";
String s2 = "ello";...
asked 10 months ago -
Financial data for Joel de Paris, Inc., for last year
follow:
Joel de Paris, Inc.
Balance...
asked 10 months ago -
Consider this reaction:
Al2(SO4)3 (aq)+ BaCl3
(aq) Al2Cl6 (aq)- +
3BaSO4(s) . What is the...
asked 10 months ago -
Suppose that Savneet is considering increasing her
recent random sample from 20 car rentals to 40...
asked 10 months ago -
Trucks arrive at an unloading terminal at an average rate of 120
per hour.
Trucks arrive...
asked 10 months ago -
Why are methanol and ethanol completely soluble in water while
octanol is not very little soluble....
asked 10 months ago -
A facilities manager at a university reads in a research report
that the mean amount of...
asked 10 months ago -
When the CuSO4 is rehydrated by adding water to the anhydrous
compound, is this an endothermic...
asked 10 months ago -
A ray of sunlight is passing from diamond into crown glass; the
angle of incidence is...
asked 10 months ago -
A block of mass 0.249 kg is placed on top of a light, vertical
spring of...
asked 10 months ago -
how do the kidneys compensate in the presences of acidosis
a) trigger hyperventilate
b) reserve acid...
asked 10 months ago -
Question 501 pts
The rental rate of capital to the firm increases. Which of the
following...
asked 10 months ago