
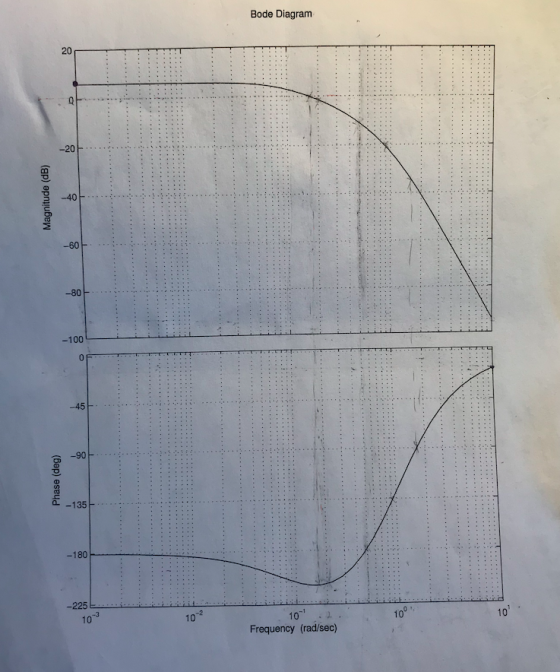
Y values are in the above graph are the same as the lower graph.
Homework Answers


Add Answer to:
Y values are in the above graph are the same as the lower
graph.
Figure 1...
The values for y axes for the first graph on the top is the same as second graph on the bottom.
 The values for y axes for the first graph on the top is the same
as second graph on the bottom.
Figure 1 shows the Bode diagrams for a particular system. a.) Sketch the polar diagram for this system, accurately indicating the location and numerical values for the phase and gain margins. The phase margin should be given in degrees, and the gain margin in actual units (i.e. not dB). Use arrows to indicate the di . rection of increasing...
The values for y axes for the first graph on the top is the same
as second graph on the bottom.
Figure 1 shows the Bode diagrams for a particular system. a.) Sketch the polar diagram for this system, accurately indicating the location and numerical values for the phase and gain margins. The phase margin should be given in degrees, and the gain margin in actual units (i.e. not dB). Use arrows to indicate the di . rection of increasing...
Figure 1 shows the Bode diagrams for a particular system. a) Sketch the polar diagram for this sy...
 Figure 1 shows the Bode diagrams for a particular system. a) Sketch the polar diagram for this system, accurately indicating the location and numerical values for the phase and gain margins. The phase margin should be given in and the gain margin in absolute units (ie. not dB). Use arrows to indicate the direction of increasing frequency on your diagram b.) Determine numerically the magnitude and gain crossover frequencies for this system. If there are more than one of either,...
5. Consider the feedback system in Figure 4 where! G(s) = 26+10% Figure 4 The Bode...
 5. Consider the feedback system in Figure 4 where! G(s) = 26+10% Figure 4 The Bode plot of G is shown in Figure 5. Boda Diagram Magnitude (dB) -100- -156 -135 -root -225 10 Frequency radici Figure 5: Bode plot of G (a) [2 marks] Find the phase margin, gain margin and gain crossover frequency (approximate as needed) for the case when C(s) = 1. PM = GM = wc = You are asked to design a feedback controller C(s)...
Consider the following magnitude and phase plot of a minimum phase system. Please answer the following and explain. Consider the following magnitude and phase plot of a minimum phase system. Is this...
 Consider the following magnitude and phase plot of a minimum
phase system. Please answer the following and explain.
Consider the following magnitude and phase plot of a minimum phase system. Is this system stable or unstable? Explain your answer. Bode Diagram: Minimum-Phase Systenm 100 Gain Crossover 40 -60 80 100 90 135 -180 225 -270 -360 Phase Crossover Op Og Frequency (rad/sec)
Consider the following magnitude and phase plot of a minimum phase system. Is this system stable or unstable?...
Consider the following magnitude and phase plot of a minimum
phase system. Please answer the following and explain.
Consider the following magnitude and phase plot of a minimum phase system. Is this system stable or unstable? Explain your answer. Bode Diagram: Minimum-Phase Systenm 100 Gain Crossover 40 -60 80 100 90 135 -180 225 -270 -360 Phase Crossover Op Og Frequency (rad/sec)
Consider the following magnitude and phase plot of a minimum phase system. Is this system stable or unstable?...
a. For the following Bode diagram, determine: Bode Diagram (7 marks Magnitude (dB) Phase (deg! Frequency...
 a. For the following Bode diagram, determine: Bode Diagram (7 marks Magnitude (dB) Phase (deg! Frequency (rad/s! 1. The gain margin. 2. The phase margin. 3. Gain crossover frequency. 4. Phase crossover frequency. 5. Comment on the stability of this system.
752) See Figure 752. D-4. The Bode gain and phase plots for a RC circuit are phase (deg), and frequency B. Also find the other shown in the fig. Determine gain (dB), (rad/sec) for the points la...
 752) See Figure 752. D-4. The Bode gain and phase plots for a RC circuit are phase (deg), and frequency B. Also find the other shown in the fig. Determine gain (dB), (rad/sec) for the points labeled A and exponents. Answers: GdBA, phA, wA, GdBB, phB,wB,C, E,F. ans:9 Bode Gain and Phase Plots Gain in dB 6 -10 12.64 10 Frequency in rad/sec 10 10 Phase in deg 765 40 10 F 4764 Frequency in rad/sec Figure 752 10 10...
Determine the proportioanl gain constant Kp and T such that the bandwidth of the closed-loop system...
 Determine the proportioanl gain constant Kp and T such that the
bandwidth of the closed-loop system is around 0.55 rad/sec and an
overshoot of around 9%. Note that the closed-loop bandwidth is
close to the gain crossover (cut-off) frequency. Check your design
in both frequency and time domain and comment. Determine the
maximum overshoot and settling time. Determine as well, using a
Bode diagram, the expression of the stead state closed loop output
for a sinusodial input with 0 deg...
Determine the proportioanl gain constant Kp and T such that the
bandwidth of the closed-loop system is around 0.55 rad/sec and an
overshoot of around 9%. Note that the closed-loop bandwidth is
close to the gain crossover (cut-off) frequency. Check your design
in both frequency and time domain and comment. Determine the
maximum overshoot and settling time. Determine as well, using a
Bode diagram, the expression of the stead state closed loop output
for a sinusodial input with 0 deg...
8. A second order lag process has a resonant frequency, (o, of 10 rad/sec, a damping ratio of 0.1, and a steady state gain, G, of 1. Use the Bode diagram in figure given to determine the gain, m,...
 8. A second order lag process has a resonant frequency, (o, of 10 rad/sec, a damping ratio of 0.1, and a steady state gain, G, of 1. Use the Bode diagram in figure given to determine the gain, m, in decibel, and the phase angle B, in degrees for the following values of the radiant frequency. Convert your decibel gain values, m, to ordinary gain values, g. (a) 0.1 rad/s, (b) 10 rad/s. 20 10 ζ-0.5 2.0 10 () ζ-20.0...
Consider the system shown as below. Draw a Bode diagram of the open-loop transfer function G(s).
 1 Consider the system shown as below. Draw a Bode diagram of the open-loop transfer function G(s). Determine the phase margin, gain-crossover frequency, gain margin and phase-crossover frequency, (Sketch the bode diagram by hand) 2 Consider the system shown as below. Use MATLAB to draw a bode diagram of the open-loop transfer function G(s). Show the gain-crossover frequency and phase-crossover frequency in the Bode diagram and determine the phase margin and gain margin. 3. Consider the system shown as below. Design a...
Figure 1 Problem 3 For the system shown in the above figure, where G(s) a) Draw...
 Figure 1 Problem 3 For the system shown in the above figure, where G(s) a) Draw a Bode diagram of the open-loop transfer function G(s) when K 10. b) On your plot, indicate the crossover frequencies, PM, and GM. Is the closed-loop system stable with K-10? c) Determine the value of K such that the phase margin is 30°. What are the gain margin and the crossover frequencies with this K? Note: You can finish problems 2-3 with the help...
 The values for y axes for the first graph on the top is the same
as second graph on the bottom.
Figure 1 shows the Bode diagrams for a particular system. a.) Sketch the polar diagram for this system, accurately indicating the location and numerical values for the phase and gain margins. The phase margin should be given in degrees, and the gain margin in actual units (i.e. not dB). Use arrows to indicate the di . rection of increasing...
The values for y axes for the first graph on the top is the same
as second graph on the bottom.
Figure 1 shows the Bode diagrams for a particular system. a.) Sketch the polar diagram for this system, accurately indicating the location and numerical values for the phase and gain margins. The phase margin should be given in degrees, and the gain margin in actual units (i.e. not dB). Use arrows to indicate the di . rection of increasing...
 Figure 1 shows the Bode diagrams for a particular system. a) Sketch the polar diagram for this system, accurately indicating the location and numerical values for the phase and gain margins. The phase margin should be given in and the gain margin in absolute units (ie. not dB). Use arrows to indicate the direction of increasing frequency on your diagram b.) Determine numerically the magnitude and gain crossover frequencies for this system. If there are more than one of either,...
 5. Consider the feedback system in Figure 4 where! G(s) = 26+10% Figure 4 The Bode plot of G is shown in Figure 5. Boda Diagram Magnitude (dB) -100- -156 -135 -root -225 10 Frequency radici Figure 5: Bode plot of G (a) [2 marks] Find the phase margin, gain margin and gain crossover frequency (approximate as needed) for the case when C(s) = 1. PM = GM = wc = You are asked to design a feedback controller C(s)...
 Consider the following magnitude and phase plot of a minimum
phase system. Please answer the following and explain.
Consider the following magnitude and phase plot of a minimum phase system. Is this system stable or unstable? Explain your answer. Bode Diagram: Minimum-Phase Systenm 100 Gain Crossover 40 -60 80 100 90 135 -180 225 -270 -360 Phase Crossover Op Og Frequency (rad/sec)
Consider the following magnitude and phase plot of a minimum phase system. Is this system stable or unstable?...
Consider the following magnitude and phase plot of a minimum
phase system. Please answer the following and explain.
Consider the following magnitude and phase plot of a minimum phase system. Is this system stable or unstable? Explain your answer. Bode Diagram: Minimum-Phase Systenm 100 Gain Crossover 40 -60 80 100 90 135 -180 225 -270 -360 Phase Crossover Op Og Frequency (rad/sec)
Consider the following magnitude and phase plot of a minimum phase system. Is this system stable or unstable?...
 a. For the following Bode diagram, determine: Bode Diagram (7 marks Magnitude (dB) Phase (deg! Frequency (rad/s! 1. The gain margin. 2. The phase margin. 3. Gain crossover frequency. 4. Phase crossover frequency. 5. Comment on the stability of this system.
 752) See Figure 752. D-4. The Bode gain and phase plots for a RC circuit are phase (deg), and frequency B. Also find the other shown in the fig. Determine gain (dB), (rad/sec) for the points labeled A and exponents. Answers: GdBA, phA, wA, GdBB, phB,wB,C, E,F. ans:9 Bode Gain and Phase Plots Gain in dB 6 -10 12.64 10 Frequency in rad/sec 10 10 Phase in deg 765 40 10 F 4764 Frequency in rad/sec Figure 752 10 10...
 Determine the proportioanl gain constant Kp and T such that the
bandwidth of the closed-loop system is around 0.55 rad/sec and an
overshoot of around 9%. Note that the closed-loop bandwidth is
close to the gain crossover (cut-off) frequency. Check your design
in both frequency and time domain and comment. Determine the
maximum overshoot and settling time. Determine as well, using a
Bode diagram, the expression of the stead state closed loop output
for a sinusodial input with 0 deg...
Determine the proportioanl gain constant Kp and T such that the
bandwidth of the closed-loop system is around 0.55 rad/sec and an
overshoot of around 9%. Note that the closed-loop bandwidth is
close to the gain crossover (cut-off) frequency. Check your design
in both frequency and time domain and comment. Determine the
maximum overshoot and settling time. Determine as well, using a
Bode diagram, the expression of the stead state closed loop output
for a sinusodial input with 0 deg...
 8. A second order lag process has a resonant frequency, (o, of 10 rad/sec, a damping ratio of 0.1, and a steady state gain, G, of 1. Use the Bode diagram in figure given to determine the gain, m, in decibel, and the phase angle B, in degrees for the following values of the radiant frequency. Convert your decibel gain values, m, to ordinary gain values, g. (a) 0.1 rad/s, (b) 10 rad/s. 20 10 ζ-0.5 2.0 10 () ζ-20.0...
 Figure 1 Problem 3 For the system shown in the above figure, where G(s) a) Draw a Bode diagram of the open-loop transfer function G(s) when K 10. b) On your plot, indicate the crossover frequencies, PM, and GM. Is the closed-loop system stable with K-10? c) Determine the value of K such that the phase margin is 30°. What are the gain margin and the crossover frequencies with this K? Note: You can finish problems 2-3 with the help...
Most questions answered within 3 hours.
-
Where is the error in this code sequence?
String s1 = "Hello";
String s2 = "ello";...
asked 10 months ago -
Financial data for Joel de Paris, Inc., for last year
follow:
Joel de Paris, Inc.
Balance...
asked 10 months ago -
Consider this reaction:
Al2(SO4)3 (aq)+ BaCl3
(aq) Al2Cl6 (aq)- +
3BaSO4(s) . What is the...
asked 10 months ago -
Suppose that Savneet is considering increasing her
recent random sample from 20 car rentals to 40...
asked 10 months ago -
Trucks arrive at an unloading terminal at an average rate of 120
per hour.
Trucks arrive...
asked 10 months ago -
Why are methanol and ethanol completely soluble in water while
octanol is not very little soluble....
asked 10 months ago -
A facilities manager at a university reads in a research report
that the mean amount of...
asked 10 months ago -
When the CuSO4 is rehydrated by adding water to the anhydrous
compound, is this an endothermic...
asked 10 months ago -
A ray of sunlight is passing from diamond into crown glass; the
angle of incidence is...
asked 10 months ago -
A block of mass 0.249 kg is placed on top of a light, vertical
spring of...
asked 10 months ago -
how do the kidneys compensate in the presences of acidosis
a) trigger hyperventilate
b) reserve acid...
asked 10 months ago -
Question 501 pts
The rental rate of capital to the firm increases. Which of the
following...
asked 10 months ago