


Homework Answers


Add Answer to:
Requirement 1a. Compute the current ratios for 2018 and 2017 Begin by selecting the formula to...
Requirement 1h. Compute the earnings per share of common stock for 2018 and 2017. Begin by...
Requirement 1h. Compute the earnings per share of common stock for 2018 and 2017. Begin by selecting the formula to compute the earnings per share of common stock. Earnings per share = (Net income - Preferred dividends) / Weighted average number of common shares outstanding Now, compute the earnings per share for 2018 and 2017. (Round your answers to the nearest cent, $X.XX.) 2018: 2017: Banfield, Inc. Comparative Balance Sheet December 31, 2018 and 2017 2018 2017 2016* Assets Current...
Requirements 1. Compute the following ratios for 2018 and 2017: a. Current ratio b. Cash ratio c. Times-interest-earned...
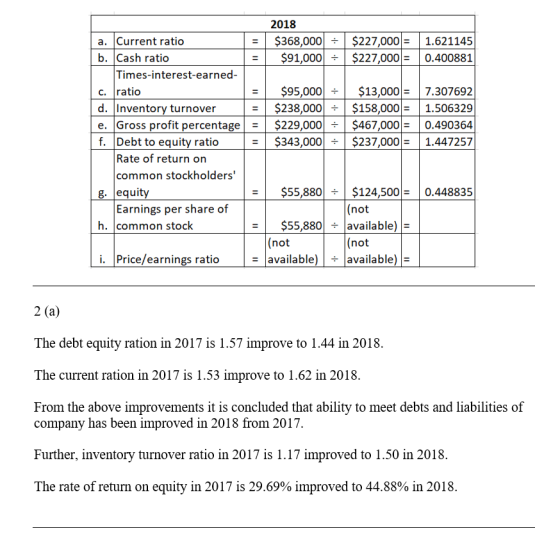
 Requirements 1. Compute the following ratios for 2018 and 2017: a. Current ratio b. Cash ratio c. Times-interest-earned ratio d. Inventory turnover e. Gross profit percentage f. Debt to equity ratio g. Rate of return on common stockholders' equity h. Earnings per share of common stock I. Pricelearnings ratio 2. Decide (a) whether Tanfield's ability to pay debts and to sell inventory improved or deteriorated during 2018 and (b) whether the investment attractiveness of its common stock appears to have...
can i get help please Canfield, Inc. Comparative Income Statement Years Ended December 31, 2018 and...
 can
i get help please
Canfield, Inc. Comparative Income Statement Years Ended December 31, 2018 and 2017 2018 2017 Net Sales Revenue $ 458,000 $ 427,000 Cost of Goods Sold 234,000 217,000 Gross Profit 224,000 210,000 Operating Expenses 134,000 132,000 Income From Operations 90,000 78,000 Interest Expense 13,000 17,000 Income Before Income Tax 77,000 61,000 Income Tax Expense 20,000 24,000 Net Income $ 57,000 $ 37,000 Print Done Canfield, Inc. Comparative Balance Sheet December 31, 2018 and 2017 Read the...
can
i get help please
Canfield, Inc. Comparative Income Statement Years Ended December 31, 2018 and 2017 2018 2017 Net Sales Revenue $ 458,000 $ 427,000 Cost of Goods Sold 234,000 217,000 Gross Profit 224,000 210,000 Operating Expenses 134,000 132,000 Income From Operations 90,000 78,000 Interest Expense 13,000 17,000 Income Before Income Tax 77,000 61,000 Income Tax Expense 20,000 24,000 Net Income $ 57,000 $ 37,000 Print Done Canfield, Inc. Comparative Balance Sheet December 31, 2018 and 2017 Read the...
Comparative financial statement data of Manfield, Inc. follow: Comparative financial statement data of Manfield, Inc. follow:...
 Comparative financial statement data of Manfield, Inc.
follow:
Comparative financial statement data of Manfield, Inc. follow: 囲(Click the icon to view the income statement.) EEE (Click the icon to view the balance sheet.) 1 (Click the icon to view the additional financial information.) Read the requirements Requirement 1a. Compute the current ratios for 2018 and 2017. Begin by selecting the formula to compute the current ratio Current ratio = Manfield, Inc. Comparative Income Statement Years Ended December 31, 2018 and...
Comparative financial statement data of Manfield, Inc.
follow:
Comparative financial statement data of Manfield, Inc. follow: 囲(Click the icon to view the income statement.) EEE (Click the icon to view the balance sheet.) 1 (Click the icon to view the additional financial information.) Read the requirements Requirement 1a. Compute the current ratios for 2018 and 2017. Begin by selecting the formula to compute the current ratio Current ratio = Manfield, Inc. Comparative Income Statement Years Ended December 31, 2018 and...
Learning Objective 4 P17-27A Using ratios to evaluate a stock investment Comparative financial statement data of...
 Learning Objective 4 P17-27A Using ratios to evaluate a stock investment Comparative financial statement data of Sanfield, Inc. follow. 1. 2018: 48.9% 2017 2016 SANFIELD, INC Comparative Income Statement Years Ended December 31, 2018 and 2017 2018 2017 Net Sales Revenue $462,000 $400,000 Cost of Goods Sold 236,000 213.000 Gross Profit 226,000 217.000 Operating Expenses 135,000 133,000 Income from Operations 91,000 $4,000 Interest Expense 8.000 12.000 Income Before Income Tax 83,000 Income Tax Expense 18.000 22.000 Net Income $65.000 $...
The balance sheets for Plasma Screens Corporation and additional information are provided below PLASMA SCREENS CORPORATION Balance Sheets December 31, 2018 and 2017 2018 2017 Assets Current assets:...
 The balance sheets for Plasma Screens Corporation and additional information are provided below PLASMA SCREENS CORPORATION Balance Sheets December 31, 2018 and 2017 2018 2017 Assets Current assets: Cash Accounts rece Inventory Investments $128,500 76,000 94,000 3,900 119,000 91,000 79,000 1,900 ivable Long-term assets: Land Equipment Less: Accumulated depreciation 470,000 780,000 (418,000) 470,000 660,000 (258,000) $ 1,134,400$ 1,162,900 Total assets Liabilities and Stockholders' Equity Current liabilities Accounts paya Interest payable Income tax payable $98,000 $84,000 11,900 4,900 ble 6,000 8,000...
QUESTION 3 From following financial statements, calculate following ratios and analyse the current year and previous...
 QUESTION 3 From following financial statements, calculate following ratios and analyse the current year and previous year performance a) Current ratio. b) Days sales outstanding (DSO). (Sales 2017 RM500m & Sales 2018 RM600m) c) Inventory turnover ratio d) Total debt to assets e) Return on assets (ROA) (Net income 2017 RM42m &Net income 2018 RM58m) Moon Inc. Balance Sheet (RM millions) as at December 31, 2015 and 2016 2015 21 51 2016 20 84 Cash Accounts receivable Inventory Prepaid expenses...
The 2018 income statement of Adrian Express reports sales of $18,612,000, cost of goods sold of...
 The 2018 income statement of Adrian Express reports sales of $18,612,000, cost of goods sold of $11,696,000, and net income of $1,680,000. Balance sheet information is provided in the following table ADRIAN EXPRESS Balance Sheets December 31, 2018 and 2017 2018 2017 Assets Current assets: Cash Accounts receivable Inventory $ 680,000 840,000 1,560,000 1,080,000 1,480,000 4,880,000 4,320,000 1,960,000 assets Total assets $9.080,000 $7,720,000 Liabilities and Stockholders' Equity Current liabilities Long-term liabilities Common stock Retained earnings $1,940,000 $1,740,000 2,380,000 2,480,000 1,920,000...
EXERCISE - CHAPTER 19. RATIOS: From the following Information, compute the ratios indicated and place the...
 EXERCISE - CHAPTER 19. RATIOS: From the following Information, compute the ratios indicated and place the proper number in the blanks provided. ASSETS: Cash $10,000 Marketable Securities $15,000 Accounts Receivable, Net $20,000 Inventory $30,000 Prepaid Assets $ 5,000 Property, Plant & Equipment $100,000 Total Assets: $180,000 LIABILITIES & STOCKHOLDERS' EQUITY: Current Liabilities $20,000 Long-Term Liabilities $80,000 Stockholders' Equity $80,000 Total Liabilities & Stockholder's Equity: $180,000 Sales $200,000 Cost of Goods Sold $150.000 Gross Margin $ 50,000 Operating Expense $ 30,000...
P18-6 The comparative statements of Corbin Company are presented below and on page 828 Compute rowanie...
 P18-6 The comparative statements of Corbin Company are presented below and on page 828 Compute rowanie (LD2) 2016 $520.000 CORBIN COMPANY Income Statement For the Years Ended December 31 2017 Net sales(all on account) 5595.000 Expenses Cost of poods sold 415.000 Selling and administrative 120.800 Interest expense 7,800 Income tax expense 15,000 Total expenses 558,600 Net income $ 16,400 14.000 48 900 $ 31 200 CORBIN COMPANY Balance Sheets December 31 2017 Assets 2016 Current assets $ 21.000 15.000 91.000...
 Requirements 1. Compute the following ratios for 2018 and 2017: a. Current ratio b. Cash ratio c. Times-interest-earned ratio d. Inventory turnover e. Gross profit percentage f. Debt to equity ratio g. Rate of return on common stockholders' equity h. Earnings per share of common stock I. Pricelearnings ratio 2. Decide (a) whether Tanfield's ability to pay debts and to sell inventory improved or deteriorated during 2018 and (b) whether the investment attractiveness of its common stock appears to have...
 can
i get help please
Canfield, Inc. Comparative Income Statement Years Ended December 31, 2018 and 2017 2018 2017 Net Sales Revenue $ 458,000 $ 427,000 Cost of Goods Sold 234,000 217,000 Gross Profit 224,000 210,000 Operating Expenses 134,000 132,000 Income From Operations 90,000 78,000 Interest Expense 13,000 17,000 Income Before Income Tax 77,000 61,000 Income Tax Expense 20,000 24,000 Net Income $ 57,000 $ 37,000 Print Done Canfield, Inc. Comparative Balance Sheet December 31, 2018 and 2017 Read the...
can
i get help please
Canfield, Inc. Comparative Income Statement Years Ended December 31, 2018 and 2017 2018 2017 Net Sales Revenue $ 458,000 $ 427,000 Cost of Goods Sold 234,000 217,000 Gross Profit 224,000 210,000 Operating Expenses 134,000 132,000 Income From Operations 90,000 78,000 Interest Expense 13,000 17,000 Income Before Income Tax 77,000 61,000 Income Tax Expense 20,000 24,000 Net Income $ 57,000 $ 37,000 Print Done Canfield, Inc. Comparative Balance Sheet December 31, 2018 and 2017 Read the...
 Comparative financial statement data of Manfield, Inc.
follow:
Comparative financial statement data of Manfield, Inc. follow: 囲(Click the icon to view the income statement.) EEE (Click the icon to view the balance sheet.) 1 (Click the icon to view the additional financial information.) Read the requirements Requirement 1a. Compute the current ratios for 2018 and 2017. Begin by selecting the formula to compute the current ratio Current ratio = Manfield, Inc. Comparative Income Statement Years Ended December 31, 2018 and...
Comparative financial statement data of Manfield, Inc.
follow:
Comparative financial statement data of Manfield, Inc. follow: 囲(Click the icon to view the income statement.) EEE (Click the icon to view the balance sheet.) 1 (Click the icon to view the additional financial information.) Read the requirements Requirement 1a. Compute the current ratios for 2018 and 2017. Begin by selecting the formula to compute the current ratio Current ratio = Manfield, Inc. Comparative Income Statement Years Ended December 31, 2018 and...
 Learning Objective 4 P17-27A Using ratios to evaluate a stock investment Comparative financial statement data of Sanfield, Inc. follow. 1. 2018: 48.9% 2017 2016 SANFIELD, INC Comparative Income Statement Years Ended December 31, 2018 and 2017 2018 2017 Net Sales Revenue $462,000 $400,000 Cost of Goods Sold 236,000 213.000 Gross Profit 226,000 217.000 Operating Expenses 135,000 133,000 Income from Operations 91,000 $4,000 Interest Expense 8.000 12.000 Income Before Income Tax 83,000 Income Tax Expense 18.000 22.000 Net Income $65.000 $...
 The balance sheets for Plasma Screens Corporation and additional information are provided below PLASMA SCREENS CORPORATION Balance Sheets December 31, 2018 and 2017 2018 2017 Assets Current assets: Cash Accounts rece Inventory Investments $128,500 76,000 94,000 3,900 119,000 91,000 79,000 1,900 ivable Long-term assets: Land Equipment Less: Accumulated depreciation 470,000 780,000 (418,000) 470,000 660,000 (258,000) $ 1,134,400$ 1,162,900 Total assets Liabilities and Stockholders' Equity Current liabilities Accounts paya Interest payable Income tax payable $98,000 $84,000 11,900 4,900 ble 6,000 8,000...
 QUESTION 3 From following financial statements, calculate following ratios and analyse the current year and previous year performance a) Current ratio. b) Days sales outstanding (DSO). (Sales 2017 RM500m & Sales 2018 RM600m) c) Inventory turnover ratio d) Total debt to assets e) Return on assets (ROA) (Net income 2017 RM42m &Net income 2018 RM58m) Moon Inc. Balance Sheet (RM millions) as at December 31, 2015 and 2016 2015 21 51 2016 20 84 Cash Accounts receivable Inventory Prepaid expenses...
 The 2018 income statement of Adrian Express reports sales of $18,612,000, cost of goods sold of $11,696,000, and net income of $1,680,000. Balance sheet information is provided in the following table ADRIAN EXPRESS Balance Sheets December 31, 2018 and 2017 2018 2017 Assets Current assets: Cash Accounts receivable Inventory $ 680,000 840,000 1,560,000 1,080,000 1,480,000 4,880,000 4,320,000 1,960,000 assets Total assets $9.080,000 $7,720,000 Liabilities and Stockholders' Equity Current liabilities Long-term liabilities Common stock Retained earnings $1,940,000 $1,740,000 2,380,000 2,480,000 1,920,000...
 EXERCISE - CHAPTER 19. RATIOS: From the following Information, compute the ratios indicated and place the proper number in the blanks provided. ASSETS: Cash $10,000 Marketable Securities $15,000 Accounts Receivable, Net $20,000 Inventory $30,000 Prepaid Assets $ 5,000 Property, Plant & Equipment $100,000 Total Assets: $180,000 LIABILITIES & STOCKHOLDERS' EQUITY: Current Liabilities $20,000 Long-Term Liabilities $80,000 Stockholders' Equity $80,000 Total Liabilities & Stockholder's Equity: $180,000 Sales $200,000 Cost of Goods Sold $150.000 Gross Margin $ 50,000 Operating Expense $ 30,000...
 P18-6 The comparative statements of Corbin Company are presented below and on page 828 Compute rowanie (LD2) 2016 $520.000 CORBIN COMPANY Income Statement For the Years Ended December 31 2017 Net sales(all on account) 5595.000 Expenses Cost of poods sold 415.000 Selling and administrative 120.800 Interest expense 7,800 Income tax expense 15,000 Total expenses 558,600 Net income $ 16,400 14.000 48 900 $ 31 200 CORBIN COMPANY Balance Sheets December 31 2017 Assets 2016 Current assets $ 21.000 15.000 91.000...
Most questions answered within 3 hours.
-
Where is the error in this code sequence?
String s1 = "Hello";
String s2 = "ello";...
asked 10 months ago -
Financial data for Joel de Paris, Inc., for last year
follow:
Joel de Paris, Inc.
Balance...
asked 10 months ago -
Consider this reaction:
Al2(SO4)3 (aq)+ BaCl3
(aq) Al2Cl6 (aq)- +
3BaSO4(s) . What is the...
asked 10 months ago -
Suppose that Savneet is considering increasing her
recent random sample from 20 car rentals to 40...
asked 10 months ago -
Trucks arrive at an unloading terminal at an average rate of 120
per hour.
Trucks arrive...
asked 10 months ago -
Why are methanol and ethanol completely soluble in water while
octanol is not very little soluble....
asked 10 months ago -
A facilities manager at a university reads in a research report
that the mean amount of...
asked 10 months ago -
When the CuSO4 is rehydrated by adding water to the anhydrous
compound, is this an endothermic...
asked 10 months ago -
A ray of sunlight is passing from diamond into crown glass; the
angle of incidence is...
asked 10 months ago -
A block of mass 0.249 kg is placed on top of a light, vertical
spring of...
asked 10 months ago -
how do the kidneys compensate in the presences of acidosis
a) trigger hyperventilate
b) reserve acid...
asked 10 months ago -
Question 501 pts
The rental rate of capital to the firm increases. Which of the
following...
asked 10 months ago