
Homework Answers
a) For the given paired data to calculate the correlation coefficient we need to do the following table calculation as:

The regression equation is calculated as;

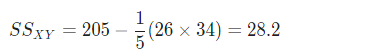
based on the table calculation the sum of squares are calculated as:
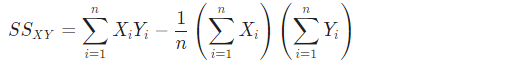

based on the sum of squares the regression equation is calculated as:


b) The sample size is n = 5 for the paired data.
The hypotheses that are assumed:


Rejection region:
The degrees of freedom is df = n-2 = 5 - 2 = 3, and using the critical value table for correlation coefficient at significance level 0.05 we create the rejection region as if r is less than -0.878 or greater than 0.878.
So, reject the Ho if r is less than -0.878 or greater than 0.878.
Conclusion:
As we can see that the r calculated in part a is 0.948 which is greater than 0.878 hence we can reject the null hypothesis.
So, we can conclude that there is a significant correlation between the variables at 0.05 level of significance.
Add Answer to:
Consider the following table of paired data. a. Calculate the correlation coefficient r. b. Use your...
Given the linear correlation coefficient r and the sample size n
Given the linear correlation coefficient r and the sample size n, determine the critical values of r and use your finding to state whether or not the given r represents a significant linear correlation. Use a significance level of 0.05. r=0.543, n = 25 Critical values: r = ±0.487, significant linear correlation Critical values: r = ±0.487, no significant linear correlation Critical values: r = ±0.396, no significant linear correlation Critical values:r = ±0.396, significant linear correlation.
Given the linear correlation coefficient r and the sample size n, determine the critical values of...
Given the linear correlation coefficient r and the sample size n, determine the critical values of r and use your finding to state whether or not the given r represents a significant linear correlation. Use a significance level of 0.05. r = 0.543, n = 25. SHOW WORK Group of answer choices A)Critical values: r = ± 0.396, significant linear correlation B)Critical values: r = ± 0.487, significant linear correlation C)Critical values: r = ± 0.396, no significant linear correlation...
Given the linear correlation coefficient r and the sample size n, determine the critical values of...
Given the linear correlation coefficient r and the sample size n, determine the critical values of r and use your finding to state whether or not the given r represents a significant linear correlation. Use a significance level of 0.05. r = 0.353, n = 15
Given the linear correlation coefficient r and the sample size n, determine the critical values of...
Given the linear correlation coefficient r and the sample size n, determine the critical values of r and use your finding to state whether or not the given r represents a significant linear correlation. Use a significance level of 0.05. r =-0.816, n =5 A. Critical values: = +/- 0.878, no significant linear correlation B. Critical values: =0.950, significant linear correlation C. Critical values: = +/- 0.878, significant linear correlation D. Critical values: = +/-0.950, no significant linear correlation
Given the linear correlation coefficient r and the sample size n, determine the critical values of...
Given the linear correlation coefficient r and the sample size n, determine the critical values of r and use your finding to state whether or not the given r represents a significant linear correlation. Use a significance level of 0.05. r = 0.543, n = 25. A. Critical values: r = plus or minus 0.487, no significant linear correlation B. Critical values: r = plus or minus 0.396, no significant linear correlation C. Critical values: r = plus or minus...
Use the table of values to calculate the linear correlation coefficient r. x y 4 -5...
Use the table of values to calculate the linear correlation coefficient r. x y 4 -5 53 -1 86 13 162 16 A. r = 0.918 B. r = 0.464 C. r = 0.619 D. r = 0.862
What is the correlation coefficient when the point (10.2) is excluded? r = _ (round to...
 What is the correlation coefficient when the point (10.2) is
excluded?
r = _ (round to three decimal places as needed.)
% 10.2.11 Question Help 104• Refer to the accompanying scatterplot. a. Examine the pattern of all 10 points and subjectively determine whether there appears to be a strong correlation between x and y. b. Find the value of the correlation coefficient r and determine whether there is a linear correlation. c. Remove the point with coordinates (1,10) and find...
What is the correlation coefficient when the point (10.2) is
excluded?
r = _ (round to three decimal places as needed.)
% 10.2.11 Question Help 104• Refer to the accompanying scatterplot. a. Examine the pattern of all 10 points and subjectively determine whether there appears to be a strong correlation between x and y. b. Find the value of the correlation coefficient r and determine whether there is a linear correlation. c. Remove the point with coordinates (1,10) and find...
if you have a correlation coefficient of r=-.82 what type of correlation does your data have?...
 if
you have a correlation coefficient of r=-.82 what type of
correlation does your data have?
QUESTION 1 If you have a Correlation Coefficient of r = -.82. What type of correlation does your data have? Positive Linear Correlation O Negative Linear Correlation Nonlinear Correlation
if
you have a correlation coefficient of r=-.82 what type of
correlation does your data have?
QUESTION 1 If you have a Correlation Coefficient of r = -.82. What type of correlation does your data have? Positive Linear Correlation O Negative Linear Correlation Nonlinear Correlation
Listed below are paired data consisting of amounts spent on advertising (in millions of dollars) and...
Listed below are paired data consisting of amounts spent on advertising (in millions of dollars) and the profits (in millions of dollars). Determine if there is a significant positive linear correlation between advertising cost and profit. Use a significance level of 0.06 and round all values to 4 decimal places. Advertising Cost Profit 3 17 4 24 5 25 6 18 7 29 8 23 9 28 10 34 11 35 R vector x values: 3,4,5,6,7,8,9,10,11 R vector y values:...
What is the critical value for the linear correlation coefficient, r, for a sample of size...
What is the critical value for the linear correlation coefficient, r, for a sample of size n = 15 with α = .01 ? (Round to the nearest thousandth. The linear correlation coefficient for a set of paired variables is r = .897. What proportion of the variation in y can be explained by the linear relationship between x and y? (Type the percentage rounded to the nearest hundredth without the % sign. The linear regression equation for a set...
 What is the correlation coefficient when the point (10.2) is
excluded?
r = _ (round to three decimal places as needed.)
% 10.2.11 Question Help 104• Refer to the accompanying scatterplot. a. Examine the pattern of all 10 points and subjectively determine whether there appears to be a strong correlation between x and y. b. Find the value of the correlation coefficient r and determine whether there is a linear correlation. c. Remove the point with coordinates (1,10) and find...
What is the correlation coefficient when the point (10.2) is
excluded?
r = _ (round to three decimal places as needed.)
% 10.2.11 Question Help 104• Refer to the accompanying scatterplot. a. Examine the pattern of all 10 points and subjectively determine whether there appears to be a strong correlation between x and y. b. Find the value of the correlation coefficient r and determine whether there is a linear correlation. c. Remove the point with coordinates (1,10) and find...
 if
you have a correlation coefficient of r=-.82 what type of
correlation does your data have?
QUESTION 1 If you have a Correlation Coefficient of r = -.82. What type of correlation does your data have? Positive Linear Correlation O Negative Linear Correlation Nonlinear Correlation
if
you have a correlation coefficient of r=-.82 what type of
correlation does your data have?
QUESTION 1 If you have a Correlation Coefficient of r = -.82. What type of correlation does your data have? Positive Linear Correlation O Negative Linear Correlation Nonlinear Correlation
Most questions answered within 3 hours.
-
Where is the error in this code sequence?
String s1 = "Hello";
String s2 = "ello";...
asked 10 months ago -
Financial data for Joel de Paris, Inc., for last year
follow:
Joel de Paris, Inc.
Balance...
asked 10 months ago -
Consider this reaction:
Al2(SO4)3 (aq)+ BaCl3
(aq) Al2Cl6 (aq)- +
3BaSO4(s) . What is the...
asked 10 months ago -
Suppose that Savneet is considering increasing her
recent random sample from 20 car rentals to 40...
asked 10 months ago -
Trucks arrive at an unloading terminal at an average rate of 120
per hour.
Trucks arrive...
asked 10 months ago -
Why are methanol and ethanol completely soluble in water while
octanol is not very little soluble....
asked 10 months ago -
A facilities manager at a university reads in a research report
that the mean amount of...
asked 10 months ago -
When the CuSO4 is rehydrated by adding water to the anhydrous
compound, is this an endothermic...
asked 10 months ago -
A ray of sunlight is passing from diamond into crown glass; the
angle of incidence is...
asked 10 months ago -
A block of mass 0.249 kg is placed on top of a light, vertical
spring of...
asked 10 months ago -
how do the kidneys compensate in the presences of acidosis
a) trigger hyperventilate
b) reserve acid...
asked 10 months ago -
Question 501 pts
The rental rate of capital to the firm increases. Which of the
following...
asked 10 months ago