

Homework Answers

 Note:As per HOMEWORKLIB RULES two
bits enough.Due to little confussion about c bit so i couldn't
solved.If you want to answer for c bit please post it
separately.
Note:As per HOMEWORKLIB RULES two
bits enough.Due to little confussion about c bit so i couldn't
solved.If you want to answer for c bit please post it
separately.
Thank you.
Add Answer to:
A study reported that 50% of men age 62 to 64 were still working, 42 %...
How are the last two calculated? &12.2.15-T Question Help A study reported that 48% of men...
 How are the last two
calculated?
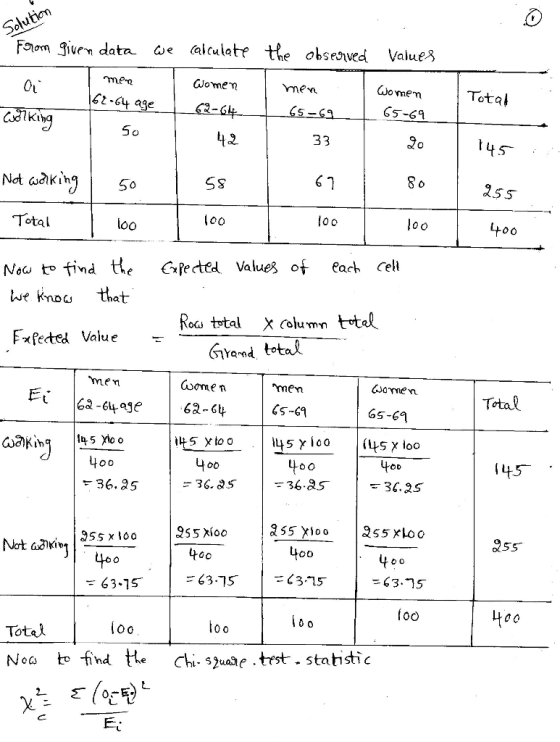
&12.2.15-T Question Help A study reported that 48% of men age 62 to 64 were still working, 34% of women age 62 to 64 were still working, 27% men age 65 to 69 were still working, and 23% of women age 65 to 69 were still working. Suppose that the study was based on a sample size of 100 in each group. Complete parts (a) through (c) a. Is there evidence of a significant...
How are the last two
calculated?
&12.2.15-T Question Help A study reported that 48% of men age 62 to 64 were still working, 34% of women age 62 to 64 were still working, 27% men age 65 to 69 were still working, and 23% of women age 65 to 69 were still working. Suppose that the study was based on a sample size of 100 in each group. Complete parts (a) through (c) a. Is there evidence of a significant...
The Excel attachment below contains the hiring salaries (in $1000) of 15 pairs of recent men...
The Excel attachment below contains the hiring salaries (in $1000) of 15 pairs of recent men and women MBA graduates. We wish to use a significance level of 0.01 to test the hypothesis that the starting salaries for male and female graduates are different. What is the P-value of the test? A. 0.009 B. 0.076 C. 0.038 D. 0.005 Men women 72 65 66 71 69 60 71 62 71 73 67 56 77 71 64 64 80 75 69...
u A study was done on body temperatures of men and women. The results are shown...
 u A study was done on body temperatures of men and women. The results are shown in the table. Assume that the two samples are independent simple random samples selected from normally distributed populations, and do not assume that the population standard deviations are equal. Complete parts (a) and (b) below. Use a 0.05 significance level for both parts Men 11 11 97.76°F 0.81°F Women 2 59 97.45°F 0.71°F S a. Test the claim that men have a higher mean...
A sample of 120 married men between 35 and 40 years of age were asked in...
A sample of 120 married men between 35 and 40 years of age were asked in 1960 the source of their greatest satisfaction in life – their career, their family, or some other activity. A similar sample of 110 married men were asked the same question in 1993. Notice that the two samples -1960 and 1993 – independent (the two samples have different participants), and each person’s score can be tallied in one and only one category –career, family, or...
David S. Moore and age at the time of the survey and whether they were still...
 David S. Moore and age at the time of the survey and whether they were still alive 20 years later. III. SMOKERS Age 18 to 44 Age 45 to 64 Age 65+ Smoker Not Smoker Not Smoker Not Dead 19 13 78 52 42 165 Alive 269 327 167 147 7 28 (a) From these data, make a two-way table of smok- ing (yes or no) by dead or alive. What percent of the smokers stayed alive for 20 years?...
Men ?? A study was done on body temperatures of men and women. The results are...
 Men ?? A study was done on body temperatures of men and women. The results are shown in the table Assume that the two samples are independent simple random samples selected ftrom normally distributed populations, and do not assume that the population standard deviations are equal Complete parts (a) and (b) below Use a 0 01 significance level for both parts Women ?2 59 97 45 F 087F The test statistic,1,(Round to two decimal places as needed ) The P-value...
A teacher decided to test the effect of sound when students were studying Students in de...
 A teacher decided to test the effect of sound when students were studying Students in de were randomly assigned into three groups of eight. All groups where when the same material and 30 minutes to study prior to being given a quiz. One group was exposed to consistent background music, one group was exposed to a soundtrack of minor construction work where the volume fluctuated and the third group was left in quiet to study. The teacher believes a constant...
The accompanying table gives results from a study of words spoken in a day by men...
 The accompanying table gives results from a study of words spoken in a day by men and women. Assume that both samples are independent simple random samples from populations having normal distributions. Use a 0.05 significance level to test the claim that the numbers of words spoken in a day by men vary more than the numbers of words spoken in a day by women. Men 185 Women 212 15,667.7 6,214.3 8,632.1 7,301.9 What are the null and altenative hypotheses?...
In recent years more people have been working past the age of 65. In 2005, 27%...
 In recent years more people have been working past the age of 65. In 2005, 27% of people age 65-69 worked. A recent report from the Organization for Economic Co-operation and Development (OECD) claimed that the percentage working had increased (USA Today, Novemb 16, 2012). The findings reported by the OECD were consistent with taking asample of 600 people aged 65-69 and finding that 180 of them were working. a. Develop a point estimate of the proportion of people aged...
In a survey of a group of men, the heights in the 20-29 age group were...
 In a survey of a group of men, the heights in the 20-29 age group were normally distributed, with a mean of 68.8 inches and a standard deviation of 3.0 inches. A study participant is randomly selected. Complete parts (a) through (d) below. (a) Find the probability that a study participant has a height that is less than 65 inches The probability that the study participant selected at random is less than 65 inches tall is (Round to four decimal...
 How are the last two
calculated?
&12.2.15-T Question Help A study reported that 48% of men age 62 to 64 were still working, 34% of women age 62 to 64 were still working, 27% men age 65 to 69 were still working, and 23% of women age 65 to 69 were still working. Suppose that the study was based on a sample size of 100 in each group. Complete parts (a) through (c) a. Is there evidence of a significant...
How are the last two
calculated?
&12.2.15-T Question Help A study reported that 48% of men age 62 to 64 were still working, 34% of women age 62 to 64 were still working, 27% men age 65 to 69 were still working, and 23% of women age 65 to 69 were still working. Suppose that the study was based on a sample size of 100 in each group. Complete parts (a) through (c) a. Is there evidence of a significant...
 u A study was done on body temperatures of men and women. The results are shown in the table. Assume that the two samples are independent simple random samples selected from normally distributed populations, and do not assume that the population standard deviations are equal. Complete parts (a) and (b) below. Use a 0.05 significance level for both parts Men 11 11 97.76°F 0.81°F Women 2 59 97.45°F 0.71°F S a. Test the claim that men have a higher mean...
 David S. Moore and age at the time of the survey and whether they were still alive 20 years later. III. SMOKERS Age 18 to 44 Age 45 to 64 Age 65+ Smoker Not Smoker Not Smoker Not Dead 19 13 78 52 42 165 Alive 269 327 167 147 7 28 (a) From these data, make a two-way table of smok- ing (yes or no) by dead or alive. What percent of the smokers stayed alive for 20 years?...
 Men ?? A study was done on body temperatures of men and women. The results are shown in the table Assume that the two samples are independent simple random samples selected ftrom normally distributed populations, and do not assume that the population standard deviations are equal Complete parts (a) and (b) below Use a 0 01 significance level for both parts Women ?2 59 97 45 F 087F The test statistic,1,(Round to two decimal places as needed ) The P-value...
 A teacher decided to test the effect of sound when students were studying Students in de were randomly assigned into three groups of eight. All groups where when the same material and 30 minutes to study prior to being given a quiz. One group was exposed to consistent background music, one group was exposed to a soundtrack of minor construction work where the volume fluctuated and the third group was left in quiet to study. The teacher believes a constant...
 The accompanying table gives results from a study of words spoken in a day by men and women. Assume that both samples are independent simple random samples from populations having normal distributions. Use a 0.05 significance level to test the claim that the numbers of words spoken in a day by men vary more than the numbers of words spoken in a day by women. Men 185 Women 212 15,667.7 6,214.3 8,632.1 7,301.9 What are the null and altenative hypotheses?...
 In recent years more people have been working past the age of 65. In 2005, 27% of people age 65-69 worked. A recent report from the Organization for Economic Co-operation and Development (OECD) claimed that the percentage working had increased (USA Today, Novemb 16, 2012). The findings reported by the OECD were consistent with taking asample of 600 people aged 65-69 and finding that 180 of them were working. a. Develop a point estimate of the proportion of people aged...
 In a survey of a group of men, the heights in the 20-29 age group were normally distributed, with a mean of 68.8 inches and a standard deviation of 3.0 inches. A study participant is randomly selected. Complete parts (a) through (d) below. (a) Find the probability that a study participant has a height that is less than 65 inches The probability that the study participant selected at random is less than 65 inches tall is (Round to four decimal...
Most questions answered within 3 hours.
-
Where is the error in this code sequence?
String s1 = "Hello";
String s2 = "ello";...
asked 11 months ago -
Financial data for Joel de Paris, Inc., for last year
follow:
Joel de Paris, Inc.
Balance...
asked 11 months ago -
Consider this reaction:
Al2(SO4)3 (aq)+ BaCl3
(aq) Al2Cl6 (aq)- +
3BaSO4(s) . What is the...
asked 11 months ago -
Suppose that Savneet is considering increasing her
recent random sample from 20 car rentals to 40...
asked 11 months ago -
Trucks arrive at an unloading terminal at an average rate of 120
per hour.
Trucks arrive...
asked 11 months ago -
Why are methanol and ethanol completely soluble in water while
octanol is not very little soluble....
asked 11 months ago -
A facilities manager at a university reads in a research report
that the mean amount of...
asked 11 months ago -
When the CuSO4 is rehydrated by adding water to the anhydrous
compound, is this an endothermic...
asked 11 months ago -
A ray of sunlight is passing from diamond into crown glass; the
angle of incidence is...
asked 11 months ago -
A block of mass 0.249 kg is placed on top of a light, vertical
spring of...
asked 11 months ago -
how do the kidneys compensate in the presences of acidosis
a) trigger hyperventilate
b) reserve acid...
asked 11 months ago -
Question 501 pts
The rental rate of capital to the firm increases. Which of the
following...
asked 11 months ago