
Homework Answers
Answer #1
Scatter Plot-Scatter plot is two dimensional plot for data visualisation. In sacatter plot we use dots to represent the values obtained for two diffrent variables.
Here we know that boiling point depends on Barometric pressure so we say that boiling point is dependent variable (or Outcome variable) and Barometric pressure is independent variable (Predictor variable)
Using Minitab software
Step 1 Enter the data
Step 2  Step 3
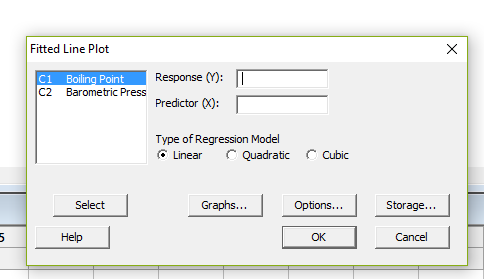
Select response as boilinig point and predictor as barometric pressure
after selecting response variable and predictor varible you get
 above given table in the
solution is analysis of variance table
above given table in the
solution is analysis of variance table
Total Degree of freedom = N(total no of observation) -1
Know the answer?
Add Answer to:
2.17 Atkinson (Plots, Transformations, and Regression, Clarendon Press, Oxford 1985) presents the following data on the...
Not the answer you're looking for?
Ask your own homework help question.
Our experts will answer your question WITHIN MINUTES for Free.
Similar Homework Help Questions
ADVERTISEMENT
Need Online Homework Help?
Ask
a QuestionGet Answers For Free
Most questions answered within 3 hours.
Most questions answered within 3 hours.
ADVERTISEMENT
Active Questions
-
Where is the error in this code sequence?
String s1 = "Hello";
String s2 = "ello";...
asked 10 months ago -
Financial data for Joel de Paris, Inc., for last year
follow:
Joel de Paris, Inc.
Balance...
asked 10 months ago -
Consider this reaction:
Al2(SO4)3 (aq)+ BaCl3
(aq) Al2Cl6 (aq)- +
3BaSO4(s) . What is the...
asked 10 months ago -
Suppose that Savneet is considering increasing her
recent random sample from 20 car rentals to 40...
asked 10 months ago -
Trucks arrive at an unloading terminal at an average rate of 120
per hour.
Trucks arrive...
asked 10 months ago -
Why are methanol and ethanol completely soluble in water while
octanol is not very little soluble....
asked 10 months ago -
A facilities manager at a university reads in a research report
that the mean amount of...
asked 10 months ago -
When the CuSO4 is rehydrated by adding water to the anhydrous
compound, is this an endothermic...
asked 10 months ago -
A ray of sunlight is passing from diamond into crown glass; the
angle of incidence is...
asked 10 months ago -
A block of mass 0.249 kg is placed on top of a light, vertical
spring of...
asked 10 months ago -
how do the kidneys compensate in the presences of acidosis
a) trigger hyperventilate
b) reserve acid...
asked 10 months ago -
Question 501 pts
The rental rate of capital to the firm increases. Which of the
following...
asked 10 months ago
ADVERTISEMENT