Upload File or can add clear full screen-shots instead , But no Pictures from mobile please
Homework Answers
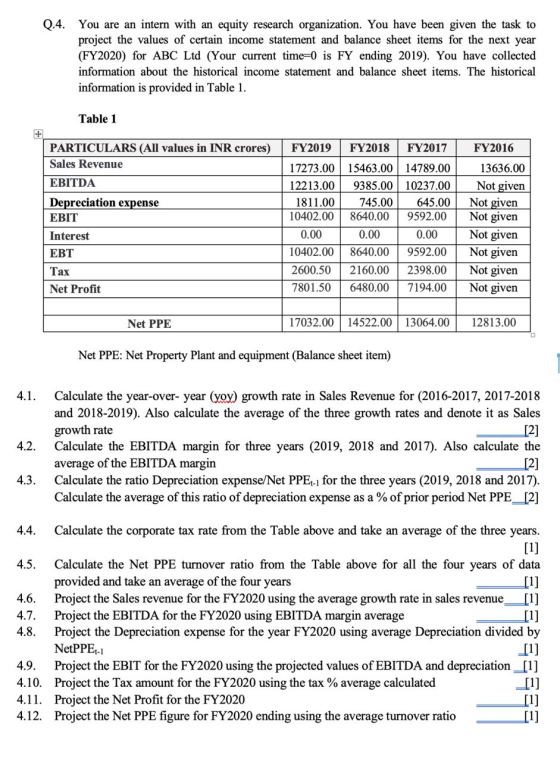
| Sales Growth | ||||
| Particulars | 2016 | 2017 | 2018 | 2019 |
| Sales | 13636 | 14789 | 15463 | 17273 |
| Growth | 0.084555588 | 0.045574413 | 0.117053612 | |
| Average | 0.082394538 |
Sales Growth = Current year sales - Previous Year sales / Previous Year sales
| EBITDA Margin | ||||
| Particulars | 2016 | 2017 | 2018 | 2019 |
| Sales (A) | 13636 | 14789 | 15463 | 17273 |
| EBITDA (B) | Not given | 10237 | 9385 | 12213 |
| EBITDA Margin (B/A) | 0.692203665 | 0.606932678 | 0.707057257 | |
| Average | 0.6687312 | |||
| Depreciation Expense as % of Net PPE | ||||
| Particulars | 2016 | 2017 | 2018 | 2019 |
| Net PPE (A) | 12813 | 13064 | 14522 | 17032 |
| Deprecaition (B) | Not given | 645 | 745 | 1811 |
| Depreciation% (B/A) | 0.049372321 | 0.051301474 | 0.106329263 | |
| Average | 0.069001019 |
| Tax % | ||||
| Particulars | 2016 | 2017 | 2018 | 2019 |
| EBT (A) | Not given | 9592 | 8640 | 10402 |
| Tax (B) | 2398 | 2150 | 2600.5 | |
| Tax% (B/A) | 0.25 | 0.248842593 | 0.25 | |
| Average | 0.249614198 |
| NET PPE Turnover | ||||
| Particulars | 2016 | 2017 | 2018 | 2019 |
| Sales (A) | 13636 | 14789 | 15463 | 17273 |
| Net PPE (B) | 12813 | 13064 | 14522 | 17032 |
| Tax% (A/B) | 1.06423164 | 1.132042254 | 1.064798237 | 1.014149836 |
| Average | 1.425073989 |
Net PPE in 2020 = Sales in 2020 / Average Net PPE Turnover = 18696.2/1.4241 = 13119.46
| INCOME STATEMENT | ||
| PARTICULARS | AMOUNT | COMMENTS |
| Sales | 18696.20085 | Using sales growth |
| EBITDA | 12502.73283 | Using EBITDA Margin |
| Less:Depreciation | -1175.225356 | Depreciation on 2019 NET PPE |
| EBIT | 11327.50747 | |
| Less:Interest | 0 | same as previous years |
| EBT | 11327.50747 | |
| Less Tax@24.9614% | -2827.506688 | Tax as % of EBT |
| PAT | 8500.000786 |
Add Answer to:
Upload File or can add clear full screen-shots instead ,
But no Pictures from mobile please...
Creating a Pro forma income statement Adapted from Advanced Problems for Spreadsheet Application, Financial Management Core...
 Creating a Pro forma income statement Adapted from Advanced Problems for Spreadsheet Application, Financial Management Core Concepts, Brooks 3rd Edition, Problem 2 Green Planet, a restaurant supply company has given you the following financial data for 2017: Green Planet Historical Income Statement 2017 $12,345,000.00 Revenue 185,175.00 $12,159,825.00 Returns Net Revenue Costs $5,555,250.00 COGS $ 1,975,200.00 $ 1,481,400.00 Fixed Costs S G & A $ Depreciation 988,320.00 $ 2,159,655.00 802,425.00 EBIT Interest Expense $ Taxable income 1,357,230.00 The tax rate in...
vertical analysis of Air canada financial statement 2018-19 Fiscal year is January-December. All values CAD Thousands...
 vertical analysis of Air canada financial statement 2018-19
Fiscal year is January-December. All values CAD Thousands 2019 2018 Sales/Revenue 486,600,0 454,900.0 Sales Growth 6.97% 18.80% Cost of Goods Sold (COGS) incl. D&A 369,400.0 344,700.0 COGS excluding D&A 275,400.0 278,600.0 Depreciation & Amortization Expense 94,000,0 66,100.0 Depreciation 94,000.0 66,100.0 COGS Growth 717% 24.04% Gross Income 117,200.0 110,200.0 Gross Income Growth 6.35% 4.95 Gross Profit Margin 24.09% SG&A Expense 60,600,0 50,300.0 Other SG&A 60,600.0 50.300.0 Income Tax 9,200.0 9,100.0 Income Tax -...
vertical analysis of Air canada financial statement 2018-19
Fiscal year is January-December. All values CAD Thousands 2019 2018 Sales/Revenue 486,600,0 454,900.0 Sales Growth 6.97% 18.80% Cost of Goods Sold (COGS) incl. D&A 369,400.0 344,700.0 COGS excluding D&A 275,400.0 278,600.0 Depreciation & Amortization Expense 94,000,0 66,100.0 Depreciation 94,000.0 66,100.0 COGS Growth 717% 24.04% Gross Income 117,200.0 110,200.0 Gross Income Growth 6.35% 4.95 Gross Profit Margin 24.09% SG&A Expense 60,600,0 50,300.0 Other SG&A 60,600.0 50.300.0 Income Tax 9,200.0 9,100.0 Income Tax -...
i Data Table Years Ended December 31, 2019 and 2018 Dollars in thousands 2019 2018 2017...
 i Data Table Years Ended December 31, 2019 and 2018 Dollars in thousands 2019 2018 2017 Net Sales Revenue Cost of Goods Sold Selling and Administrative Expenses Interest Expense $ 184,000 $ 152,000 98,500 83,000 47,000 43,000 8,500 10,000 13,000 9,500 $ 17,000 $ 6,500 Income Tax Expense Net Income Additional data: Total Assets Common Stockholders' Equity Preferred Dividends Common Shares Outstanding During the Year $ 210,000 $ 190,000 $ 174,000 92,500 82,500 77,000 3,000 3,0000 20,000 20,000 10,000 Print...
C10-1 Calculating Interest and Depreciation Expenses and Effects on Loan Covenant Ratios Zoom Car Corporation (ZCC)...
 C10-1 Calculating Interest and Depreciation Expenses and Effects on Loan Covenant Ratios Zoom Car Corporation (ZCC) plans to purchase approximately 100 vehicles on December 31, 2015, for $2.3 million, plus 10 percent total sales tax. ZCC expects to use the vehicles for 5 years and then sell them for approximately $460,000. ZCC anticipates the following average vehicle use over each year ended December 31: 2016 2017 20,000 2018 2019 2020 Miles per year 14,500 15,000 14,500 5,000 To finance the...
Score: 0 of 1 pt 8 of 11 (10 complete) HW Score: 90.91%, 10 of 11 pts 18-14 (similar to) Question Help Under the a...
 Score: 0 of 1 pt 8 of 11 (10 complete) HW Score: 90.91%, 10 of 11 pts 18-14 (similar to) Question Help Under the assumption that KMS's market share will increase by 0.23% per year, you determine that the plant will require an expansion in 2018. The expansion will cost $21.5 million. Assume the following: the debt financing of the expansion will be delayed accordingly (end of 2018). KMS uses a ten-year bond, interest rates remain the same at 7.3%,...
I am attaching the pictures. the instructions is the first pic and the answers go on...
 I am attaching the pictures. the instructions is the first pic
and the answers go on the last page
The Income Statement and Balance Sheet for The Home Depot, Inc. can be found as separate worksheets on tabs (a) and (b), respectively. On worksheet O, prepare a ratio analysis for 2017 and 2016 that includes the following ratios: Current ratio Net income to average common stockholder's equity Inventory turnover Number of days' sales in accounts receivable (assume 365 days in...
I am attaching the pictures. the instructions is the first pic
and the answers go on the last page
The Income Statement and Balance Sheet for The Home Depot, Inc. can be found as separate worksheets on tabs (a) and (b), respectively. On worksheet O, prepare a ratio analysis for 2017 and 2016 that includes the following ratios: Current ratio Net income to average common stockholder's equity Inventory turnover Number of days' sales in accounts receivable (assume 365 days in...
2017 Mariner, Inc. Comparative Income Statement Years Ended December 31, 2019 and 2018 2019 2018 Dollars...
 2017 Mariner, Inc. Comparative Income Statement Years Ended December 31, 2019 and 2018 2019 2018 Dollars in thousands Net Sales Revenue $ 183,000 $ 151,000 Cost of Goods Sold 94,000 85,000 Selling and Administrative Expenses 45,500 40,000 Interest Expense 7,500 10,500 Income Tax Expense 13,000 11,500 $ 23,000 $ 4,000 Net Income Additional data: Total Assets Common Stockholders' Equity Preferred Dividends Common Shares outstanding During the Year $ 206,000 $ 189,000 $ 174,000 93,000 85,500 81,000 3,000 3,000 0 25,000...
Hi I need help with this question please. Account information from the comparative financial statements of...
Hi I need help with this question please. Account information from the comparative financial statements of Hopkins Ltd. for the year ended December 31 appear below: 2019 2018 Accounts receivable $129,000 $48,900 Accounts payable 62,000 51,000 Accumulated Depreciation 60,000 30,000 Bonds Payable (due June 30, 2030) 200,000 200,000 Building 280,000 280,000 Cash 95,000 42,000 Common Shares 100,000 100,000 Cost of goods sold 510,000 390,000 Depreciation expense 30,000 30,000 Income tax expense 20,000 18,000 Income tax payable 4,000 3,800 Interest expense...
Calculating Ratios and Estimating Credit Rating The following data are from Kellogg’s 10-K report dated December...
Calculating Ratios and Estimating Credit Rating The following data are from Kellogg’s 10-K report dated December 29, 2018 ($ millions). Revenue $13,547 Earnings from continuing operations $1,344 Interest expense 287 Capital expenditures (CAPEX) 578 Tax expense 181 Total debt 8,893 Amortization expense 23 Average assets 17,066 Depreciation expense 493 a. Use the data above to calculate the following ratios: EBITA/Average assets, EBITA Margin, EBITA/ Interest expense, Debt/EBITDA, CAPEX/Depreciation Expense. Definitions for these ratios are in Exhibit 7.4. b. Refer to...
9. The firm has RM20,000 cash, RM30,000 marketable securities and RM15,000 inventories. Plant and equipment is...
 9. The firm has RM20,000 cash, RM30,000 marketable securities and RM15,000 inventories. Plant and equipment is RM100,000, accrued expense RM5,000, account payable is RM12,000 and total equities is RM120,000. How much its long term debt? 10. If the firm forecast its total asset RM130,000 and its projected sources of financing is RM113,000. What is it's discretionary financing needs (DFN)? Should the firm borrow/ finance their assets for the bank? 11. If sales in 2018 is RM 100 million, EBT is...
 Creating a Pro forma income statement Adapted from Advanced Problems for Spreadsheet Application, Financial Management Core Concepts, Brooks 3rd Edition, Problem 2 Green Planet, a restaurant supply company has given you the following financial data for 2017: Green Planet Historical Income Statement 2017 $12,345,000.00 Revenue 185,175.00 $12,159,825.00 Returns Net Revenue Costs $5,555,250.00 COGS $ 1,975,200.00 $ 1,481,400.00 Fixed Costs S G & A $ Depreciation 988,320.00 $ 2,159,655.00 802,425.00 EBIT Interest Expense $ Taxable income 1,357,230.00 The tax rate in...
 vertical analysis of Air canada financial statement 2018-19
Fiscal year is January-December. All values CAD Thousands 2019 2018 Sales/Revenue 486,600,0 454,900.0 Sales Growth 6.97% 18.80% Cost of Goods Sold (COGS) incl. D&A 369,400.0 344,700.0 COGS excluding D&A 275,400.0 278,600.0 Depreciation & Amortization Expense 94,000,0 66,100.0 Depreciation 94,000.0 66,100.0 COGS Growth 717% 24.04% Gross Income 117,200.0 110,200.0 Gross Income Growth 6.35% 4.95 Gross Profit Margin 24.09% SG&A Expense 60,600,0 50,300.0 Other SG&A 60,600.0 50.300.0 Income Tax 9,200.0 9,100.0 Income Tax -...
vertical analysis of Air canada financial statement 2018-19
Fiscal year is January-December. All values CAD Thousands 2019 2018 Sales/Revenue 486,600,0 454,900.0 Sales Growth 6.97% 18.80% Cost of Goods Sold (COGS) incl. D&A 369,400.0 344,700.0 COGS excluding D&A 275,400.0 278,600.0 Depreciation & Amortization Expense 94,000,0 66,100.0 Depreciation 94,000.0 66,100.0 COGS Growth 717% 24.04% Gross Income 117,200.0 110,200.0 Gross Income Growth 6.35% 4.95 Gross Profit Margin 24.09% SG&A Expense 60,600,0 50,300.0 Other SG&A 60,600.0 50.300.0 Income Tax 9,200.0 9,100.0 Income Tax -...
 i Data Table Years Ended December 31, 2019 and 2018 Dollars in thousands 2019 2018 2017 Net Sales Revenue Cost of Goods Sold Selling and Administrative Expenses Interest Expense $ 184,000 $ 152,000 98,500 83,000 47,000 43,000 8,500 10,000 13,000 9,500 $ 17,000 $ 6,500 Income Tax Expense Net Income Additional data: Total Assets Common Stockholders' Equity Preferred Dividends Common Shares Outstanding During the Year $ 210,000 $ 190,000 $ 174,000 92,500 82,500 77,000 3,000 3,0000 20,000 20,000 10,000 Print...
 C10-1 Calculating Interest and Depreciation Expenses and Effects on Loan Covenant Ratios Zoom Car Corporation (ZCC) plans to purchase approximately 100 vehicles on December 31, 2015, for $2.3 million, plus 10 percent total sales tax. ZCC expects to use the vehicles for 5 years and then sell them for approximately $460,000. ZCC anticipates the following average vehicle use over each year ended December 31: 2016 2017 20,000 2018 2019 2020 Miles per year 14,500 15,000 14,500 5,000 To finance the...
 Score: 0 of 1 pt 8 of 11 (10 complete) HW Score: 90.91%, 10 of 11 pts 18-14 (similar to) Question Help Under the assumption that KMS's market share will increase by 0.23% per year, you determine that the plant will require an expansion in 2018. The expansion will cost $21.5 million. Assume the following: the debt financing of the expansion will be delayed accordingly (end of 2018). KMS uses a ten-year bond, interest rates remain the same at 7.3%,...
 I am attaching the pictures. the instructions is the first pic
and the answers go on the last page
The Income Statement and Balance Sheet for The Home Depot, Inc. can be found as separate worksheets on tabs (a) and (b), respectively. On worksheet O, prepare a ratio analysis for 2017 and 2016 that includes the following ratios: Current ratio Net income to average common stockholder's equity Inventory turnover Number of days' sales in accounts receivable (assume 365 days in...
I am attaching the pictures. the instructions is the first pic
and the answers go on the last page
The Income Statement and Balance Sheet for The Home Depot, Inc. can be found as separate worksheets on tabs (a) and (b), respectively. On worksheet O, prepare a ratio analysis for 2017 and 2016 that includes the following ratios: Current ratio Net income to average common stockholder's equity Inventory turnover Number of days' sales in accounts receivable (assume 365 days in...
 2017 Mariner, Inc. Comparative Income Statement Years Ended December 31, 2019 and 2018 2019 2018 Dollars in thousands Net Sales Revenue $ 183,000 $ 151,000 Cost of Goods Sold 94,000 85,000 Selling and Administrative Expenses 45,500 40,000 Interest Expense 7,500 10,500 Income Tax Expense 13,000 11,500 $ 23,000 $ 4,000 Net Income Additional data: Total Assets Common Stockholders' Equity Preferred Dividends Common Shares outstanding During the Year $ 206,000 $ 189,000 $ 174,000 93,000 85,500 81,000 3,000 3,000 0 25,000...
 9. The firm has RM20,000 cash, RM30,000 marketable securities and RM15,000 inventories. Plant and equipment is RM100,000, accrued expense RM5,000, account payable is RM12,000 and total equities is RM120,000. How much its long term debt? 10. If the firm forecast its total asset RM130,000 and its projected sources of financing is RM113,000. What is it's discretionary financing needs (DFN)? Should the firm borrow/ finance their assets for the bank? 11. If sales in 2018 is RM 100 million, EBT is...
Most questions answered within 3 hours.
-
Where is the error in this code sequence?
String s1 = "Hello";
String s2 = "ello";...
asked 10 months ago -
Financial data for Joel de Paris, Inc., for last year
follow:
Joel de Paris, Inc.
Balance...
asked 10 months ago -
Consider this reaction:
Al2(SO4)3 (aq)+ BaCl3
(aq) Al2Cl6 (aq)- +
3BaSO4(s) . What is the...
asked 10 months ago -
Suppose that Savneet is considering increasing her
recent random sample from 20 car rentals to 40...
asked 10 months ago -
Trucks arrive at an unloading terminal at an average rate of 120
per hour.
Trucks arrive...
asked 10 months ago -
Why are methanol and ethanol completely soluble in water while
octanol is not very little soluble....
asked 10 months ago -
A facilities manager at a university reads in a research report
that the mean amount of...
asked 10 months ago -
When the CuSO4 is rehydrated by adding water to the anhydrous
compound, is this an endothermic...
asked 10 months ago -
A ray of sunlight is passing from diamond into crown glass; the
angle of incidence is...
asked 10 months ago -
A block of mass 0.249 kg is placed on top of a light, vertical
spring of...
asked 10 months ago -
how do the kidneys compensate in the presences of acidosis
a) trigger hyperventilate
b) reserve acid...
asked 10 months ago -
Question 501 pts
The rental rate of capital to the firm increases. Which of the
following...
asked 10 months ago