
Homework Answers

Add Answer to:
The annual earings in dollars) of 35 randomly selected microbiologists are shown in the data table....
The annual earnings (in dollars) of 35 randomly selected microbiologists are shown in the data table...
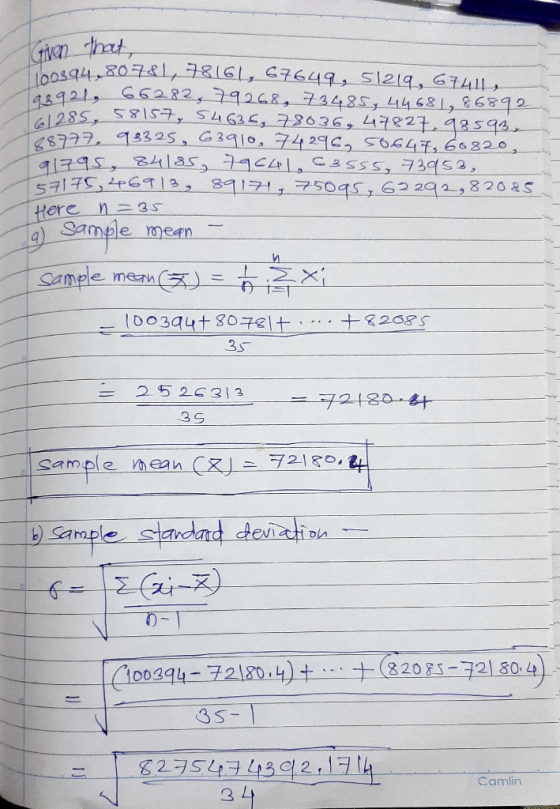
 The annual earnings (in dollars) of 35 randomly selected microbiologists are shown in the data table standard deviation, and (c) construct a 98% confidence interval for the population mean Use the data to (a) ind the sample mean,(@) ind the sample 100280 81,152 78,150 67.253 51,697 67,509 94,086 65,697 79,003 73,406 44,405 86,657 61,031 57,482 54,744 77,810 47,840 98,986 81,540 92,698 63,451 75,019 50,970 60,924 91,170 84 207 79,815 64,115 74,085 56,666 46,663 89,718 75,718 61,546 82,211 (a) Find the...
The following data represent the concentration of dissolved organic carbon (mg/L) collected from 20 samples of...
 The following data represent the concentration of dissolved organic carbon (mg/L) collected from 20 samples of organic soil. Assume that the population is normally distributed Complete parts (a) through (c) on the right 15.42 29.80 27.10 16.51 15.42 8.81 15.42 20.46 14.90 33.67 30.91 14.86 1750 15.35 9.72 19.80 14.86 8.09 15.42 18.30 (a) Find the sample mean The sample meanis L (Round to two decimal places as needed.) (b) Find the sample standard deviation The sample standard deviation is...
The grade point averages (GPA) for 12 randomly selected college students are shown on the right....
 The grade point averages (GPA) for 12 randomly selected college students are shown on the right. Complete parts (a) through (c) below 2.5 34 2.6 1.9 0.5 4.0 2.2 1.2 3.8 0.2 2.3 3.1 Assume the population is normally distributed. (a) Find the sample mean. x(Round to two decimal places as needed) (b) Find the sample standard deviation. s(Round to two decimal places as needed.) (c) Construct a 95% confidence interval for the population mean A 95% confidence interval for...
The grade point averages (GPA) for 12 randomly selected college students are shown on the right....
 The grade point averages (GPA) for 12 randomly selected college
students are shown on the right. Complete parts (a) through (c)
below. Assume the population is normally distributed.
2.1, 3.1, 2.6, 1.5, 0.6, 4.0, 2.1, 1.1, 3.6, 0.5, 2.1, 3.4
construct a 90% confidence interval for the population mean
The grade point averages (GPA) for 12 randomly selected college students are shown on the right. Complete parts (a) through (c) 2.1 below. 1.5 Assume the population is normally distributed. 2.1...
The grade point averages (GPA) for 12 randomly selected college
students are shown on the right. Complete parts (a) through (c)
below. Assume the population is normally distributed.
2.1, 3.1, 2.6, 1.5, 0.6, 4.0, 2.1, 1.1, 3.6, 0.5, 2.1, 3.4
construct a 90% confidence interval for the population mean
The grade point averages (GPA) for 12 randomly selected college students are shown on the right. Complete parts (a) through (c) 2.1 below. 1.5 Assume the population is normally distributed. 2.1...
The grade point averages (GPA) for 1212 randomly selected college students are shown on the right....
The grade point averages (GPA) for 1212 randomly selected college students are shown on the right. Complete parts (a) through (c) below. Assume the population is normally distributed. 2.52.5 3.33.3 2.92.9 1.91.9 0.80.8 4.04.0 2.42.4 1.41.4 3.73.7 0.40.4 2.12.1 3.43.4 (a) Find the sample mean. x overbarxequals=nothing (Round to two decimal places as needed.) (b) Find the sample standard deviation. sequals=nothing (Round to two decimal places as needed.)(c) Construct a 9999% confidence interval for the population mean muμ. A 9999%...
The grade point averages (GPA) for 12 randomly selected college students are shown on the right....
The grade point averages (GPA) for 12 randomly selected college students are shown on the right. Complete parts (a) through (c) below. Assume the population is normally distributed. 2.2 3.2 2.5 1.6 0.6 4.0 2.3 1.3 3.6 0.3 2.3 3.4 a) Find the sample mean. x overbar x equals= (Round to two decimal places as needed.) (b) Find the sample standard deviation. s equals= (Round to two decimal places as needed.) (c) Construct a 95% confidence interval for the population...
A researcher records the repair cost for 19 randomly selected stereos. A sample mean of $60.45...
A researcher records the repair cost for 19 randomly selected stereos. A sample mean of $60.45 and standard deviation of $24.00 are subsequently computed. Determine the 98% confidence interval for the mean repair cost for the stereos. Assume the population is approximately normal. Step 1 of 2: Find the critical value that should be used in constructing the confidence interval. Round your answer to three decimal places. Step 2 of 2: Construct the 98% confidence interval. Round your answer to...
14. Randomly selected students participated in an experiment to test their ability to determine when one...
14. Randomly selected students participated in an experiment to test their ability to determine when one minute (or sixty seconds) has passed. Forty students yielded a sample mean of 61.8 seconds. Assuming that σ=9.2 seconds, construct and interpret a 95% confidence interval estimate of the population mean of all students. What is the 95% confidence interval for the population mean μ? ____<μ<____ (Type integers or decimals rounded to one decimal place as needed.) 15. Salaries of 43 college graduates who...
Wo e parts (a) The grade point averages (GPA) for 12 randomly selected college students are...
 Wo e parts (a) The grade point averages (GPA) for 12 randomly selected college students are shown on the right Complet 0 0 1.6 0.8 40 2.1 1.1 3.5 0.4 2.4 3.3 through (c) below Assume the population is normally distributed (a) Find the sample mearn xRound to two decimal places as needed) (b) Find the sample standard deviation sRound to two decimal places as needed.) (c) Construct a 95% confidence interval for the population mean A 95% confidence interval...
989 The state test scores for 12 randomly selected high school seniors are shown on the...
 989 The state test scores for 12 randomly selected high school seniors are shown on the right. Complete parts (a) through (c) below. Assume the population is normally distributed. 1424 695 725 623 1221 721 745 1442 837 544 947 (a) Find the sample mean. X= (Round to one decimal place as needed.) (b) Find the sample standard deviation. s= (Round to one decimal place as needed.) (c) Construct a 95% confidence interval for the population mean H. A 95%...
 The annual earnings (in dollars) of 35 randomly selected microbiologists are shown in the data table standard deviation, and (c) construct a 98% confidence interval for the population mean Use the data to (a) ind the sample mean,(@) ind the sample 100280 81,152 78,150 67.253 51,697 67,509 94,086 65,697 79,003 73,406 44,405 86,657 61,031 57,482 54,744 77,810 47,840 98,986 81,540 92,698 63,451 75,019 50,970 60,924 91,170 84 207 79,815 64,115 74,085 56,666 46,663 89,718 75,718 61,546 82,211 (a) Find the...
 The following data represent the concentration of dissolved organic carbon (mg/L) collected from 20 samples of organic soil. Assume that the population is normally distributed Complete parts (a) through (c) on the right 15.42 29.80 27.10 16.51 15.42 8.81 15.42 20.46 14.90 33.67 30.91 14.86 1750 15.35 9.72 19.80 14.86 8.09 15.42 18.30 (a) Find the sample mean The sample meanis L (Round to two decimal places as needed.) (b) Find the sample standard deviation The sample standard deviation is...
 The grade point averages (GPA) for 12 randomly selected college students are shown on the right. Complete parts (a) through (c) below 2.5 34 2.6 1.9 0.5 4.0 2.2 1.2 3.8 0.2 2.3 3.1 Assume the population is normally distributed. (a) Find the sample mean. x(Round to two decimal places as needed) (b) Find the sample standard deviation. s(Round to two decimal places as needed.) (c) Construct a 95% confidence interval for the population mean A 95% confidence interval for...
 The grade point averages (GPA) for 12 randomly selected college
students are shown on the right. Complete parts (a) through (c)
below. Assume the population is normally distributed.
2.1, 3.1, 2.6, 1.5, 0.6, 4.0, 2.1, 1.1, 3.6, 0.5, 2.1, 3.4
construct a 90% confidence interval for the population mean
The grade point averages (GPA) for 12 randomly selected college students are shown on the right. Complete parts (a) through (c) 2.1 below. 1.5 Assume the population is normally distributed. 2.1...
The grade point averages (GPA) for 12 randomly selected college
students are shown on the right. Complete parts (a) through (c)
below. Assume the population is normally distributed.
2.1, 3.1, 2.6, 1.5, 0.6, 4.0, 2.1, 1.1, 3.6, 0.5, 2.1, 3.4
construct a 90% confidence interval for the population mean
The grade point averages (GPA) for 12 randomly selected college students are shown on the right. Complete parts (a) through (c) 2.1 below. 1.5 Assume the population is normally distributed. 2.1...
 Wo e parts (a) The grade point averages (GPA) for 12 randomly selected college students are shown on the right Complet 0 0 1.6 0.8 40 2.1 1.1 3.5 0.4 2.4 3.3 through (c) below Assume the population is normally distributed (a) Find the sample mearn xRound to two decimal places as needed) (b) Find the sample standard deviation sRound to two decimal places as needed.) (c) Construct a 95% confidence interval for the population mean A 95% confidence interval...
 989 The state test scores for 12 randomly selected high school seniors are shown on the right. Complete parts (a) through (c) below. Assume the population is normally distributed. 1424 695 725 623 1221 721 745 1442 837 544 947 (a) Find the sample mean. X= (Round to one decimal place as needed.) (b) Find the sample standard deviation. s= (Round to one decimal place as needed.) (c) Construct a 95% confidence interval for the population mean H. A 95%...
Most questions answered within 3 hours.
-
Where is the error in this code sequence?
String s1 = "Hello";
String s2 = "ello";...
asked 11 months ago -
Financial data for Joel de Paris, Inc., for last year
follow:
Joel de Paris, Inc.
Balance...
asked 11 months ago -
Consider this reaction:
Al2(SO4)3 (aq)+ BaCl3
(aq) Al2Cl6 (aq)- +
3BaSO4(s) . What is the...
asked 11 months ago -
Suppose that Savneet is considering increasing her
recent random sample from 20 car rentals to 40...
asked 11 months ago -
Trucks arrive at an unloading terminal at an average rate of 120
per hour.
Trucks arrive...
asked 11 months ago -
Why are methanol and ethanol completely soluble in water while
octanol is not very little soluble....
asked 11 months ago -
A facilities manager at a university reads in a research report
that the mean amount of...
asked 11 months ago -
When the CuSO4 is rehydrated by adding water to the anhydrous
compound, is this an endothermic...
asked 11 months ago -
A ray of sunlight is passing from diamond into crown glass; the
angle of incidence is...
asked 11 months ago -
A block of mass 0.249 kg is placed on top of a light, vertical
spring of...
asked 11 months ago -
how do the kidneys compensate in the presences of acidosis
a) trigger hyperventilate
b) reserve acid...
asked 11 months ago -
Question 501 pts
The rental rate of capital to the firm increases. Which of the
following...
asked 11 months ago