
Homework Answers
Solution:-
39)
a) p-value = 0.01
D.F = 5
X2 = 20.36
P(X2 > 30.6) = 0.01

b) p-value = 0.504
D.F = 4
X2 = 3.33
P(X2 > 3.33) = 0.504

c) P(- 30.76 < t < 30.76) = less than 0.00001
D.F = 6
t-value = 30.76
P(- 30.76 < t < 30.76) = less than 0.00001
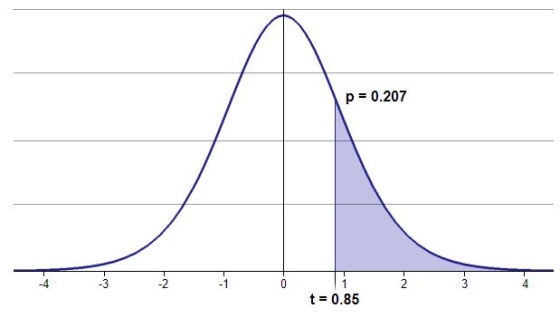
d) P( t > 0.85) = 0.207
D.F = 11
t-value = 0.85
P( t > 0.85) = 0.207
e) P(F> 30) = 0.001
DF1 = 1
DF2 = 8
F-value = 30
P(F> 30) = 0.001

f) P(F> 2.5) = 0.199
DF1 = 3
DF2 = 4
F-value = 2.5
P(F> 2.5) = 0.199

Add Answer to:
39. Answer the following questions in a few words without doing any calculations a. Using the...
1) After doing so, find DF 2)using the df you determine previously, include your Chi-Square Critical value in this resp...
 1) After doing so, find DF
2)using the df you determine previously, include your Chi-Square
Critical value in this response
3) Indicate below (written in APA format) the outcome of the
Chi-Square test you just performed.
Given the following data, determine the Chi-Square obtained statistic: 8 8 4
Given the following data, determine the Chi-Square obtained statistic: 8 8 4
1) After doing so, find DF
2)using the df you determine previously, include your Chi-Square
Critical value in this response
3) Indicate below (written in APA format) the outcome of the
Chi-Square test you just performed.
Given the following data, determine the Chi-Square obtained statistic: 8 8 4
Given the following data, determine the Chi-Square obtained statistic: 8 8 4
RuPaul is using a Chi Square Goodness of Fit test to determine whether there are any...
RuPaul is using a Chi Square Goodness of Fit test to determine whether there are any preferences among four fan-favorite drag queens (Monét X Change, Farrah Moan, Monique Heart, and Manila Luzon). If she computed a Chi Square value of 4.6 from a sample size of 60, what would be Cohen's w?
a) true b) false 42. For a chi-square distributed random variable with 10 degrees of freedom and a level of sigpificanoe computed value of the test statistics is 16.857. This will lead us to reje...
 a) true b) false 42. For a chi-square distributed random variable with 10 degrees of freedom and a level of sigpificanoe computed value of the test statistics is 16.857. This will lead us to reject the null hypothesis. a) true b) false 43. A chi-square goodness-of-fit test is always conducted as: a. a lower-tail test b. an upper-tail test d. either a lower tail or upper tail test e. a two-tail test 44. A left-tailed area in the chi-square distribution...
(If any are cut off answer what you can see) 3A) 3b) 3C) 3D) You are...
 (If any are cut off answer what you can see)
3A)
3b)
3C)
3D)
You are conducting a multinomial Goodness of Fit hypothesis test for the claim that the 4 categories occur with the following frequencies: H:PA = 0.25; PB = 0.4; Pc = 0.1; PD 0.25 Complete the table. Report all answers accurate to three decimal places. Observed Expected Category Residual Frequency Frequency А 17 B 57 с 8 D 23 What is the chi-square test-statistic for this data?...
(If any are cut off answer what you can see)
3A)
3b)
3C)
3D)
You are conducting a multinomial Goodness of Fit hypothesis test for the claim that the 4 categories occur with the following frequencies: H:PA = 0.25; PB = 0.4; Pc = 0.1; PD 0.25 Complete the table. Report all answers accurate to three decimal places. Observed Expected Category Residual Frequency Frequency А 17 B 57 с 8 D 23 What is the chi-square test-statistic for this data?...
A testcross with a heterozygote b+bc+c produces a total of 700 offspring. The following are the...
A testcross with a heterozygote b+bc+c produces a total of 700 offspring. The following are the resulting phenotypes of the progeny and corresponding numbers: b+c+ = 270; bc = 255; b+c=83; bc+=92 1) Based on the data, do the genes b and c appear to be linked or are they assorting independently? How did you determine your answer? If the genes are linked, which of the above genotypes are the non-recombinant progeny? Also, is the original configuration of the loci...
Test the claim that your coin is fair, using a 5% level of significance. Use the...
Test the claim that your coin is fair, using a 5% level of significance. Use the Chi-Square Goodness of Fit Test. Toss a coin at least 12 times (why?). a) What is n? What are the number of Tails and Heads? These are the Observed frequencies. b) What are the Expected frequencies? c) What is the Null Hypothesis H0? d) What is the Alternative Hypothesis H1? e) Is this a left, right, or two-tailed test? f) Chi-Square Test Statistic =?...
Using the data given in the table below, answer the following questions. (Round your final answers...
Using the data given in the table below, answer the following questions. (Round your final answers to 3 decimal places.) Moviegoer Snack Spending (n = 10) Age (X) Spent (Y) 30 2.89 48 6.55 32 1.43 14 6.20 37 6.25 31 6.78 39 3.50 27 6.14 18 8.24 47 4.36 (c) What is the p-value for a two-tailed test? p-value
im confused about using the Chi square value to answer these questions Complete the Chi Squared...
 im confused about using the Chi square value to answer these
questions
Complete the Chi Squared analysis below by filling in the empty white cells. Do not round numbers up until the very end (the final chi squared value) which you can round to one decimal place. It's best to do this in Excel or another spreadsheet program. Phenotypes Observed # Expected # O-E d d /E LO) d) Black, no horns 44 44.25 -0.25 0.0625 0.00141243 Black, homs 144.25...
im confused about using the Chi square value to answer these
questions
Complete the Chi Squared analysis below by filling in the empty white cells. Do not round numbers up until the very end (the final chi squared value) which you can round to one decimal place. It's best to do this in Excel or another spreadsheet program. Phenotypes Observed # Expected # O-E d d /E LO) d) Black, no horns 44 44.25 -0.25 0.0625 0.00141243 Black, homs 144.25...
Does the data meet the conditions for the chi-square test? StatCrunch Instructions: Test of Independence Using...
 Does the data meet the conditions for the chi-square test?
StatCrunch Instructions: Test of Independence Using
Technology
Next we will use StatCrunch to calculate the expected
counts:
Enter Yes and No in column var1.
Enter the observed counts as they appear in the table above
(not including the totals) into columns var2 and var3.
Rename: var1 as "911", var2 as "No Risk" and var3 as "M to S
Risk"
Choose Stat -> Tables -> Contingency -> with
summary
Select the...
Does the data meet the conditions for the chi-square test?
StatCrunch Instructions: Test of Independence Using
Technology
Next we will use StatCrunch to calculate the expected
counts:
Enter Yes and No in column var1.
Enter the observed counts as they appear in the table above
(not including the totals) into columns var2 and var3.
Rename: var1 as "911", var2 as "No Risk" and var3 as "M to S
Risk"
Choose Stat -> Tables -> Contingency -> with
summary
Select the...
For the following experiment/question, pick the most appropriate statistical test. You have the following statistical tests...
For the following experiment/question, pick the most appropriate statistical test. You have the following statistical tests as choices: some may be used more than once, others not at all. Assume homogeneity of variance (where applicable) and the validity of parametric tests (where applicable), unless something is directly stated (e.g., “the data are not at all normal”) or otherwise indicated (viz., by the inspection of the data) which would indicate a strong and obvious violation of an assumption. This means you must...
 1) After doing so, find DF
2)using the df you determine previously, include your Chi-Square
Critical value in this response
3) Indicate below (written in APA format) the outcome of the
Chi-Square test you just performed.
Given the following data, determine the Chi-Square obtained statistic: 8 8 4
Given the following data, determine the Chi-Square obtained statistic: 8 8 4
1) After doing so, find DF
2)using the df you determine previously, include your Chi-Square
Critical value in this response
3) Indicate below (written in APA format) the outcome of the
Chi-Square test you just performed.
Given the following data, determine the Chi-Square obtained statistic: 8 8 4
Given the following data, determine the Chi-Square obtained statistic: 8 8 4
 a) true b) false 42. For a chi-square distributed random variable with 10 degrees of freedom and a level of sigpificanoe computed value of the test statistics is 16.857. This will lead us to reject the null hypothesis. a) true b) false 43. A chi-square goodness-of-fit test is always conducted as: a. a lower-tail test b. an upper-tail test d. either a lower tail or upper tail test e. a two-tail test 44. A left-tailed area in the chi-square distribution...
 (If any are cut off answer what you can see)
3A)
3b)
3C)
3D)
You are conducting a multinomial Goodness of Fit hypothesis test for the claim that the 4 categories occur with the following frequencies: H:PA = 0.25; PB = 0.4; Pc = 0.1; PD 0.25 Complete the table. Report all answers accurate to three decimal places. Observed Expected Category Residual Frequency Frequency А 17 B 57 с 8 D 23 What is the chi-square test-statistic for this data?...
(If any are cut off answer what you can see)
3A)
3b)
3C)
3D)
You are conducting a multinomial Goodness of Fit hypothesis test for the claim that the 4 categories occur with the following frequencies: H:PA = 0.25; PB = 0.4; Pc = 0.1; PD 0.25 Complete the table. Report all answers accurate to three decimal places. Observed Expected Category Residual Frequency Frequency А 17 B 57 с 8 D 23 What is the chi-square test-statistic for this data?...
 im confused about using the Chi square value to answer these
questions
Complete the Chi Squared analysis below by filling in the empty white cells. Do not round numbers up until the very end (the final chi squared value) which you can round to one decimal place. It's best to do this in Excel or another spreadsheet program. Phenotypes Observed # Expected # O-E d d /E LO) d) Black, no horns 44 44.25 -0.25 0.0625 0.00141243 Black, homs 144.25...
im confused about using the Chi square value to answer these
questions
Complete the Chi Squared analysis below by filling in the empty white cells. Do not round numbers up until the very end (the final chi squared value) which you can round to one decimal place. It's best to do this in Excel or another spreadsheet program. Phenotypes Observed # Expected # O-E d d /E LO) d) Black, no horns 44 44.25 -0.25 0.0625 0.00141243 Black, homs 144.25...
 Does the data meet the conditions for the chi-square test?
StatCrunch Instructions: Test of Independence Using
Technology
Next we will use StatCrunch to calculate the expected
counts:
Enter Yes and No in column var1.
Enter the observed counts as they appear in the table above
(not including the totals) into columns var2 and var3.
Rename: var1 as "911", var2 as "No Risk" and var3 as "M to S
Risk"
Choose Stat -> Tables -> Contingency -> with
summary
Select the...
Does the data meet the conditions for the chi-square test?
StatCrunch Instructions: Test of Independence Using
Technology
Next we will use StatCrunch to calculate the expected
counts:
Enter Yes and No in column var1.
Enter the observed counts as they appear in the table above
(not including the totals) into columns var2 and var3.
Rename: var1 as "911", var2 as "No Risk" and var3 as "M to S
Risk"
Choose Stat -> Tables -> Contingency -> with
summary
Select the...
Most questions answered within 3 hours.
-
Where is the error in this code sequence?
String s1 = "Hello";
String s2 = "ello";...
asked 10 months ago -
Financial data for Joel de Paris, Inc., for last year
follow:
Joel de Paris, Inc.
Balance...
asked 10 months ago -
Consider this reaction:
Al2(SO4)3 (aq)+ BaCl3
(aq) Al2Cl6 (aq)- +
3BaSO4(s) . What is the...
asked 10 months ago -
Suppose that Savneet is considering increasing her
recent random sample from 20 car rentals to 40...
asked 10 months ago -
Trucks arrive at an unloading terminal at an average rate of 120
per hour.
Trucks arrive...
asked 10 months ago -
Why are methanol and ethanol completely soluble in water while
octanol is not very little soluble....
asked 10 months ago -
A facilities manager at a university reads in a research report
that the mean amount of...
asked 10 months ago -
When the CuSO4 is rehydrated by adding water to the anhydrous
compound, is this an endothermic...
asked 10 months ago -
A ray of sunlight is passing from diamond into crown glass; the
angle of incidence is...
asked 10 months ago -
A block of mass 0.249 kg is placed on top of a light, vertical
spring of...
asked 10 months ago -
how do the kidneys compensate in the presences of acidosis
a) trigger hyperventilate
b) reserve acid...
asked 10 months ago -
Question 501 pts
The rental rate of capital to the firm increases. Which of the
following...
asked 10 months ago