You may need to use the appropriate appendix table or technology to answer this question. Consider...
You may need to use the appropriate appendix table or technology to answer this question.
Consider the following hypothesis test.
H0: μ1 − μ2 = 0
Ha: μ1 − μ2 ≠ 0
The following results are for two independent samples taken from the two populations.
| Sample 1 | Sample 2 |
|---|---|
|
n1 = 80 |
n2 = 70 |
|
x1 = 104 |
x2 = 106 |
|
σ1 = 8.2 |
σ2 = 7.4 |
(a)
What is the value of the test statistic? (Round your answer to two decimal places.)
(b)
What is the p-value? (Round your answer to four decimal places.)
Homework Answers
SOLUTION:
From given data,
The following results are for two independent samples taken from the two populations.
| Sample 1 | Sample 2 |
The statistical software output for this problem is:
Two sample Z summary hypothesis test:
: Mean
of population 1 (Std. dev. = 8.2)
: Mean
of population 2 (Std. dev. = 7.4)
-
:
Difference between two means
Null hypothesis : H0 : -
=
0
Alternative hypothesis : Ha : -
0
(a) What is the value of the test statistic? (Round your answer to two decimal places.)
Test statistic
z = ( -
) /
sqrt (
/
+
/
)
z = (104 - 106 ) / sqrt (8.22 / 80 + 7.42 / 70)
z = -2 / 1.273886
z = -1.56
(b) What is the p-value? (Round your answer to four decimal places.)
p-value
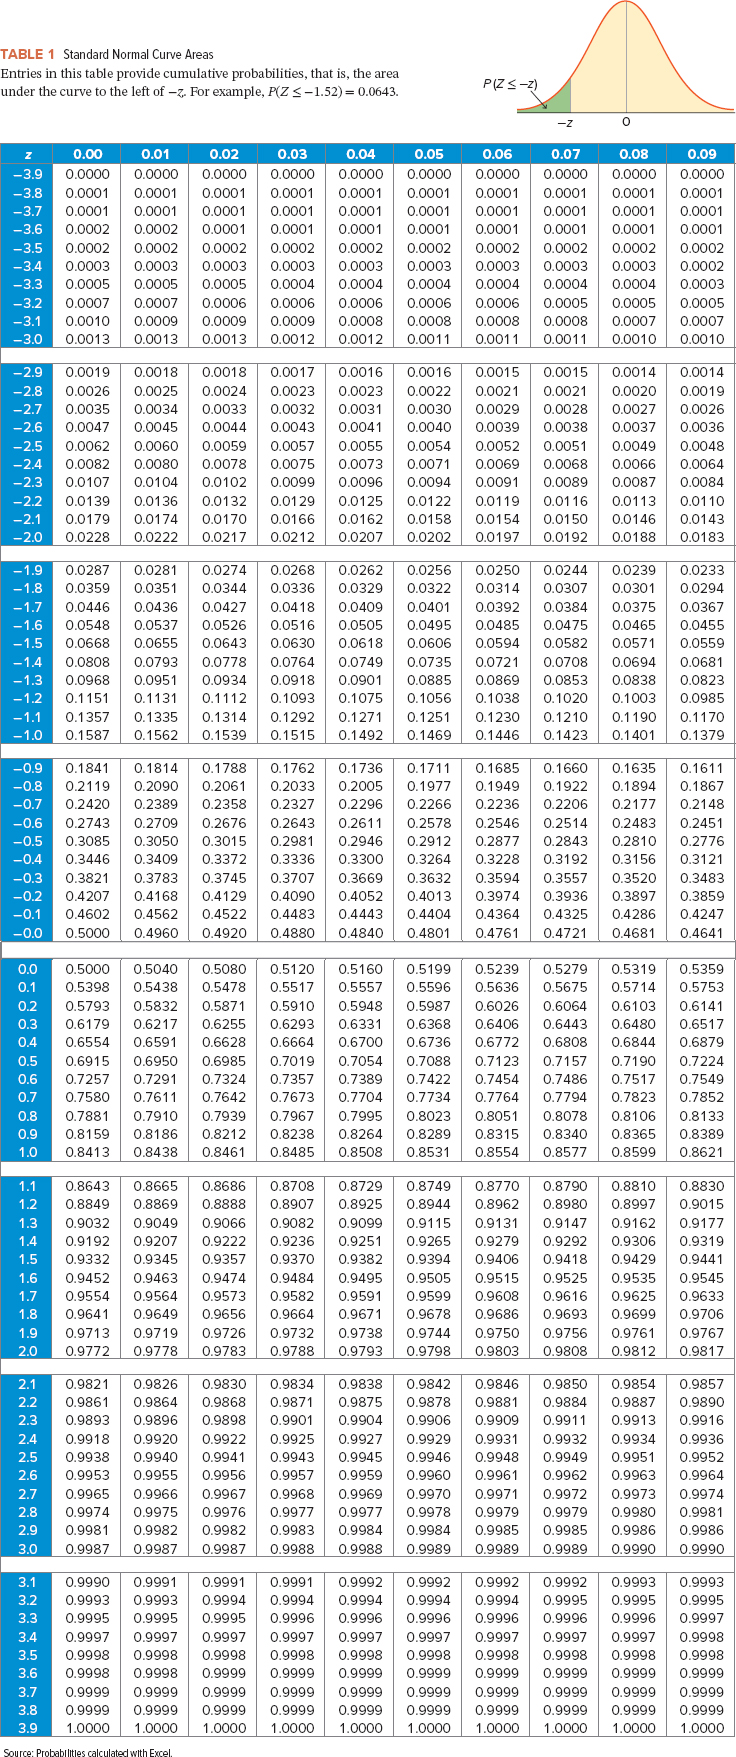
p-value = P (z > -1.56 )
= 1 - P (z < -1.56 )
= 1 - 0.05938
= 0.94062
Please thumbs-up / vote up this answer if it was helpful. In case of any problem, please comment below. I will surely help. Down-votes are permanent and not notified to us, so we can't help in that case.
Add Answer to:
You may need to use the appropriate appendix table or technology
to answer this question.
Consider...
You may need to use the appropriate technology to answer this question. Consider the following hypothesis...
You may need to use the appropriate technology to answer this question. Consider the following hypothesis test. H0: μ1 − μ2 = 0 Ha: μ1 − μ2 ≠ 0 The following results are from independent samples taken from two populations. Sample 1 Sample 2 n1 = 35 n2 = 40 x1 = 13.6 x2 = 10.1 s1 = 5.4 s2 = 8.1 (a) What is the value of the test statistic? (Use x1 − x2. Round your answer to three...
Consider the following hypothesis test. H0: μ1 − μ2 = 0 Ha: μ1 − μ2 ≠...
Consider the following hypothesis test. H0: μ1 − μ2 = 0 Ha: μ1 − μ2 ≠ 0 The following results are for two independent samples taken from the two populations. Sample 1 Sample 2 n1 = 80 n2 = 70 x1 = 104 x2 = 106 σ1 = 8.4 σ2 = 7.2 (a) What is the value of the test statistic? (Round your answer to two decimal places.) (b) What is the p-value? (Round your answer to four decimal places.)...
You may need to use the appropriate appendix table or technology to answer this question. The...
You may need to use the appropriate appendix table or technology to answer this question. The following results come from two independent random samples taken of two populations. Sample 1 Sample 2 n1 = 50 n2 = 25 x1 = 13.6 x2 = 11.6 σ1 = 2.3 σ2 = 3 (a) What is the point estimate of the difference between the two population means? (Use x1 − x2.) (b) Provide a 90% confidence interval for the difference between the two...
You may need to use the appropriate technology to answer this question. Consider the following hypothesis...
 You may need to use the appropriate technology to answer this question. Consider the following hypothesis test. The following results are from independent samples taken from two populations assuming the variances are unequal Sample 1 Sample 2 n1-352 x1-13.6x2-10.1 s, 5.5 s = 8.1 n2-40 (a) What is the value of the test statistic? (Use X1-x2. Round your answer to three decimal places.) (b) What is the degrees of freedom for the t distribution? (Round your answer down to the...
You may need to use the appropriate appendix table or technology to answer this question. A magazine uses a survey of readers to obtain customer satisfaction ratings for the nation's largest retai...
You may need to use the appropriate appendix table or technology to answer this question. A magazine uses a survey of readers to obtain customer satisfaction ratings for the nation's largest retailers. Each survey respondent is asked to rate a specified retailer in terms of six factors: quality of products, selection, value, checkout efficiency, service, and store layout. An overall satisfaction score summarizes the rating for each respondent with 100 meaning the respondent is completely satisfied in terms of all...
Consider the following competing hypotheses and accompanying sample data drawn independently from normally distributed populations. (You may find it useful to reference the appropriate table: z table or t table)
 Consider the following competing hypotheses and accompanying sample data drawn independently from normally distributed populations. (You may find it useful to reference the appropriate table: z table or t table) H0: μ1 − μ2 = 0HA: μ1 − μ2 ≠ 0 x−1x−1 = 57x−2 = 63σ1 = 11.5σ2 = 15.2n1 = 20n2 = 20a-1. Calculate the value of the test statistic. (Negative values should be indicated by a minus sign. Round all intermediate calculations to at least 4 decimal places and final answer to 2 decimal places.)Test Statistic ?
You may need to use the appropriate technology to answer this question. Are nursing salaries in...
You may need to use the appropriate technology to answer this question. Are nursing salaries in City A lower than those in City B? As reported by a newspaper, salary data show staff nurses in City A earn less than staff nurses in City B. Suppose that in a follow-up study of 40 staff nurses in City A and 50 staff nurses in City B you obtain the following results. Assume population variances are unknown and unequal. City A City...
Consider the following hypothesis test. H0: μ1 − μ2 = 0 Ha: μ1 − μ2 ≠...
Consider the following hypothesis test. H0: μ1 − μ2 = 0 Ha: μ1 − μ2 ≠ 0 The following results are from independent samples taken from two populations assuming the variances are unequal. Sample 1 Sample 2 n1 = 35 n2 = 40 x1 = 13.6 x2 = 10.1 s1 = 5.3 s2 = 8.3 What is the value of the test statistic? (Use x1 − x2 .(Round your answer to three decimal places.) ________________. What is the degrees of...
Consider the following hypothesis test. H0: μ1 − μ2 = 0 Ha: μ1 − μ2 ≠...
Consider the following hypothesis test. H0: μ1 − μ2 = 0 Ha: μ1 − μ2 ≠ 0 The following results are from independent samples taken from two populations. Sample 1 Sample 2 n1 = 35 n2 = 40 x1 = 13.6 x2 = 10.1 s1 = 5.9 s2 = 8.5 (a) What is the value of the test statistic? (Use x1 − x2. Round your answer to three decimal places.) (b) What is the degrees of freedom for the t...
 You may need to use the appropriate technology to answer this question. Consider the following hypothesis test. The following results are from independent samples taken from two populations assuming the variances are unequal Sample 1 Sample 2 n1-352 x1-13.6x2-10.1 s, 5.5 s = 8.1 n2-40 (a) What is the value of the test statistic? (Use X1-x2. Round your answer to three decimal places.) (b) What is the degrees of freedom for the t distribution? (Round your answer down to the...
Most questions answered within 3 hours.
-
Where is the error in this code sequence?
String s1 = "Hello";
String s2 = "ello";...
asked 11 months ago -
Financial data for Joel de Paris, Inc., for last year
follow:
Joel de Paris, Inc.
Balance...
asked 11 months ago -
Consider this reaction:
Al2(SO4)3 (aq)+ BaCl3
(aq) Al2Cl6 (aq)- +
3BaSO4(s) . What is the...
asked 11 months ago -
Suppose that Savneet is considering increasing her
recent random sample from 20 car rentals to 40...
asked 11 months ago -
Trucks arrive at an unloading terminal at an average rate of 120
per hour.
Trucks arrive...
asked 11 months ago -
Why are methanol and ethanol completely soluble in water while
octanol is not very little soluble....
asked 11 months ago -
A facilities manager at a university reads in a research report
that the mean amount of...
asked 11 months ago -
When the CuSO4 is rehydrated by adding water to the anhydrous
compound, is this an endothermic...
asked 11 months ago -
A ray of sunlight is passing from diamond into crown glass; the
angle of incidence is...
asked 11 months ago -
A block of mass 0.249 kg is placed on top of a light, vertical
spring of...
asked 11 months ago -
how do the kidneys compensate in the presences of acidosis
a) trigger hyperventilate
b) reserve acid...
asked 11 months ago -
Question 501 pts
The rental rate of capital to the firm increases. Which of the
following...
asked 11 months ago