
Homework Answers


Add Answer to:
Chapter 6, Section 4-HT, Exercise 209 Use the f-distribution and the given sample results to complete...
Chapter 6, Section 1-HT, Exercise 048 Use the normal distribution and the given sample results to...
Chapter 6, Section 1-HT, Exercise 048 Use the normal distribution and the given sample results to complete the test of the given hypotheses. Assume the results come from a random sample and use a 5% significance level. Test H0 : p=0.25vs Ha : p≠0.25 using the sample results p^=0.16 with n=100 Round your answer for the test statistic to two decimal places, and your answer for the p-value to three decimal places. a) test statistic = b) p-value = c)...
Chapter 6, Section 1-HT, Exercise 046 Use the normal distribution and the given sample results to...
Chapter 6, Section 1-HT, Exercise 046 Use the normal distribution and the given sample results to complete the test of the given hypotheses. Assume the results come from a random sample and use a 5% significance level. Test H0 : p=0.5 vs Ha : p>0.5 using the sample results p^=0.56 with n=25 Round your answer for the test statistic to two decimal places, and your answer for the p-value to three decimal places. test statistic = Enter your answer; test...
Chapter 6, Section 1-D, Exercise 002 Incorrect Consider random samples of size 900 from a population...
 Chapter 6, Section 1-D, Exercise 002 Incorrect Consider random samples of size 900 from a population with proportion 0.70. Find the standard error of the distribution of sample proportions. Round your answer for the standard error to three decimal places. 0.159 standard error = the absolute tolerance is +/-0.001 Click if you would like to Show Work for this question: Open Show Work Chapter 6, Section 4-HT, Exercise 209 Use the t-distribution and the given sample results to complete the...
Use a t-distribution and the given matched pair sample results to complete the test of the...
 Use a t-distribution and the given matched pair sample results to complete the test of the given hypotheses. Assume the results come from random samples, and if the sample sizes are small, assume the underlying distribution of the differences is relatively normal.Assume that differences are computed using d Test Ho : μd-0 vs Ha : ț1d > 0 using the paired data in the following table Situation 1 135 156 130 175 153 148 180 135 168 157 Situation 2...
Use at distribution and the given matched pair sample results to complete the test of the...
 Use at distribution and the given matched pair sample results to complete the test of the given hypotheses. Assume the results come from random samples, and if the sample sizes are small assume the underlying distribution of the differences is relatively normal. Assume that differences are computed using d = x - X2. Test HoH = Ovs II. O using the paired difference sample results d = 12.35,4 = 12.4.nu = 25. Give the test statistic and the p-value. Round...
Question 11 --/2 View Policies Current Attempt in Progress Use the t-distribution and the given sample...
 Question 11 --/2 View Policies Current Attempt in Progress Use the t-distribution and the given sample results to complete the test of the given hypotheses. Assume the results come from random samples, and if the sample sizes are small, assume the underlying distributions are relatively normal. Test Ho : µr = Hc vs H. : Hr < µc using the fact that the treatment group (T) has a sample mean of 8.6 with a standard deviation of 4.1 while the...
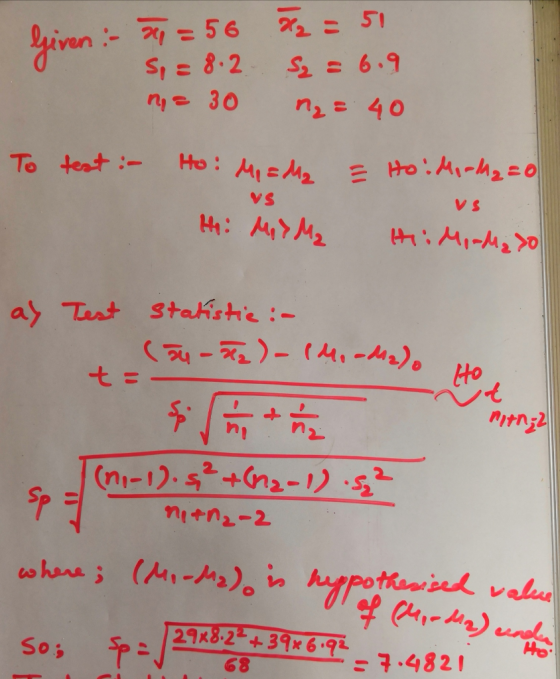
Use the t-distribution and the given sample results to complete the test of the given hypotheses....
Use the t-distribution and the given sample results to complete the test of the given hypotheses. Assume the results come from random samples, and if the sample sizes are small, assume the underlying distributions are relatively normal. Test Upper H Subscript 0 Baseline : mu Subscript 1 Baseline equals mu Subscript 2 vs Upper H Subscript a Baseline : mu Subscript 1 Baseline not-equals mu Subscript 2 using the sample results x Overscript bar EndScripts Subscript 1 Baseline equals 15.3,...
SET THREE: Chapter 6, Section 1-HT, Exercise 046 Use the normal distribution and the given sample...
SET THREE: Chapter 6, Section 1-HT, Exercise 046 Use the normal distribution and the given sample results to complete the test of the given hypotheses. Assume the results come from a random sample and use a 5% significance level. Test H0 : p=0.5 vs Ha : p>0.5 using the sample results p^=0.60 with n=25 Round your answer for the test statistic to two decimal places, and your answer for the p-value to three decimal places. test statistic = ________________ p-value...
Chapter 6, Section 5, Exercise 238 Use a t-distribution and the given matched pair sample results...
 Chapter 6, Section 5, Exercise 238 Use a t-distribution and the given matched pair sample results to complete the test of the given hypotheses. Assume the results come from random samples and if the sample sizes are small, assume the underlying distribution of the differences is relatively normal. Assume that differences are computed using d = X1-X2 . Test Ho : μι-μ. vs Ha : Hj < u2 using the paired data in the following table: Treatment14 12 5215 14...
a) Use the t-distribution to find a confidence interval for a difference in means μ1-μ2 given...
a) Use the t-distribution to find a confidence interval for a difference in means μ1-μ2 given the relevant sample results. Give the best estimate for μ1-μ2, the margin of error, and the confidence interval. Assume the results come from random samples from populations that are approximately normally distributed. A 90% confidence interval for μ1-μ2 using the sample results x¯1=8.8, s1=2.7, n1=50 and x¯2=13.3, s2=6.0, n2=50 Enter the exact answer for the best estimate and round your answers for the margin...
 Chapter 6, Section 1-D, Exercise 002 Incorrect Consider random samples of size 900 from a population with proportion 0.70. Find the standard error of the distribution of sample proportions. Round your answer for the standard error to three decimal places. 0.159 standard error = the absolute tolerance is +/-0.001 Click if you would like to Show Work for this question: Open Show Work Chapter 6, Section 4-HT, Exercise 209 Use the t-distribution and the given sample results to complete the...
 Use a t-distribution and the given matched pair sample results to complete the test of the given hypotheses. Assume the results come from random samples, and if the sample sizes are small, assume the underlying distribution of the differences is relatively normal.Assume that differences are computed using d Test Ho : μd-0 vs Ha : ț1d > 0 using the paired data in the following table Situation 1 135 156 130 175 153 148 180 135 168 157 Situation 2...
 Use at distribution and the given matched pair sample results to complete the test of the given hypotheses. Assume the results come from random samples, and if the sample sizes are small assume the underlying distribution of the differences is relatively normal. Assume that differences are computed using d = x - X2. Test HoH = Ovs II. O using the paired difference sample results d = 12.35,4 = 12.4.nu = 25. Give the test statistic and the p-value. Round...
 Question 11 --/2 View Policies Current Attempt in Progress Use the t-distribution and the given sample results to complete the test of the given hypotheses. Assume the results come from random samples, and if the sample sizes are small, assume the underlying distributions are relatively normal. Test Ho : µr = Hc vs H. : Hr < µc using the fact that the treatment group (T) has a sample mean of 8.6 with a standard deviation of 4.1 while the...
 Chapter 6, Section 5, Exercise 238 Use a t-distribution and the given matched pair sample results to complete the test of the given hypotheses. Assume the results come from random samples and if the sample sizes are small, assume the underlying distribution of the differences is relatively normal. Assume that differences are computed using d = X1-X2 . Test Ho : μι-μ. vs Ha : Hj < u2 using the paired data in the following table: Treatment14 12 5215 14...
Most questions answered within 3 hours.
-
Where is the error in this code sequence?
String s1 = "Hello";
String s2 = "ello";...
asked 10 months ago -
Financial data for Joel de Paris, Inc., for last year
follow:
Joel de Paris, Inc.
Balance...
asked 10 months ago -
Consider this reaction:
Al2(SO4)3 (aq)+ BaCl3
(aq) Al2Cl6 (aq)- +
3BaSO4(s) . What is the...
asked 10 months ago -
Suppose that Savneet is considering increasing her
recent random sample from 20 car rentals to 40...
asked 10 months ago -
Trucks arrive at an unloading terminal at an average rate of 120
per hour.
Trucks arrive...
asked 10 months ago -
Why are methanol and ethanol completely soluble in water while
octanol is not very little soluble....
asked 10 months ago -
A facilities manager at a university reads in a research report
that the mean amount of...
asked 10 months ago -
When the CuSO4 is rehydrated by adding water to the anhydrous
compound, is this an endothermic...
asked 10 months ago -
A ray of sunlight is passing from diamond into crown glass; the
angle of incidence is...
asked 10 months ago -
A block of mass 0.249 kg is placed on top of a light, vertical
spring of...
asked 10 months ago -
how do the kidneys compensate in the presences of acidosis
a) trigger hyperventilate
b) reserve acid...
asked 10 months ago -
Question 501 pts
The rental rate of capital to the firm increases. Which of the
following...
asked 10 months ago