The data in the table above represent the market demand and supply for strawberries over a...
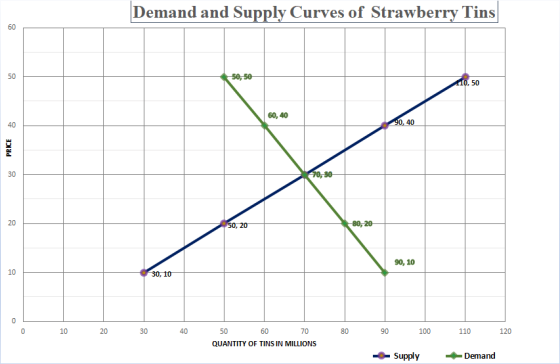
The data in the table above represent the market demand and supply for strawberries over a range of prices.
|
Price (cents) |
Quantity Demanded (million tins/year) |
Quantity Supplied (million tins/year) |
|
10 |
90 |
30 |
|
20 |
80 |
50 |
|
30 |
70 |
70 |
|
40 |
60 |
90 |
|
50 |
50 |
110 |
1. Plot on a single diagram the demand and supply curve. (4 marks)
2. What would be the excess demand or supply if price were set at 10 cent? (4 marks)
3. What would be the excess demand or supply if price were set at 40 cent? (4 marks)
4. Define the equilibrium of a market. Find the equilibrium price and quantity. (4 marks)
5. Suppose that an increase in consumers’ income results in an increase of strawberries’ demand. The demand of strawberries rises by 30 million tins/year at each price level. Find the new equilibrium price and quantity. (4 marks) T
Homework Answers
Answer
1. 
______________________________________________________________________
2. Excess demand for tin = 60 millions per year.
From the table, we see that if price were set at 10 cent, the quantity demanded for tins is 90 millions per year and the quantity supplied of tins is 30 millions per year.
 The excess demand of tins = 90 millions - 30
millions = 60 millions per year.
The excess demand of tins = 90 millions - 30
millions = 60 millions per year.
___________________________________________________________________
3. Excess supply of tin = 60 millions per year.
From the table, we see that if price were set at 40 cent, the quantity demanded for tins is 60 millions per year and the quantity supplied of tins is 90 millions per year.
The excess supply of tins = 90 millions - 30
millions = 60 millions per year.
__________________________________________________________________
4. Equilibrium price = 30 cents ; Equilibrium quantity = 70 million strawberry tins per year.
 The market equilibrium is attained when at
a price both the quantity demanded and quantity supplied are
equal.
The market equilibrium is attained when at
a price both the quantity demanded and quantity supplied are
equal.
From the above figure, we see that at the price of 30 cents, both the quantity demanded and quantity supplied of strawberry tins are 70 millions per year.
The
equilibrium price = 30 cents ; equilibrium quantity = 70 million
strawberry tins per year.
_______________________________________________________________
5. New equilibrium price = 40 cents ; New equilibrium quantity = 90 million strawberry tins per year.
| Prices |
Quantity Demanded (Million Tins per Year) |
New quantity Demanded (Million Tins per Year) |
Quantity Supplied (Million Tins per Year) |
| 10 | 90 | 120 | 30 |
| 20 | 80 | 110 | 50 |
| 30 | 70 | 100 | 70 |
| 40 | 60 | 90 | 90 |
| 50 | 50 | 80 | 110 |
From the above table, we see that at the price of 40 cents, both the quantity demanded and quantity supplied of strawberry tins are 90 millions per year.
The
new equilibrium price = 40 cents ; new equilibrium quantity = 90
million strawberry tins per year.
_______________________________________________________________
Add Answer to:
The data in the table above represent the market demand and
supply for strawberries over a...
The following table shows the market demand and supply for soybeans. TABLE DATA: Quantity SuPplied (Bushels...
 The following table shows the market demand and supply for soybeans. TABLE DATA: Quantity SuPplied (Bushels per Year) Quantity Demanded (Bushels per Year) Price ($ per Bushel) 10 120 0 110 9 10 8 20 100 7 30 90 6 40 80 5 50 70 4 60 60 3 70 50 2 80 40 1 90 30 0 100 20 Instructions: Enter your responses as a whole number a. What is the equilibrium price? $ per bushel b. What is...
Question 7 [15 points] The demand and supply for strawberries in Pacifico are as follows: a)...
 Question 7 [15 points] The demand and supply for strawberries in Pacifico are as follows: a) Suppose that the supply of strawberries increase by 50 percent. Find the new quantity supplied in the table below. Quantity Demanded Initial Quantity Supplied New Quantity Supplied Price (S) 320 100 120 140 160 180 200 4.25 4.5 4.75 280 260 240 220 200 5.25 5.5 b) What are the equilibrium price and equilibrium quantity for the initial supply? Equilibrium Price$o Equilibrium Quantity c)...
Use the demand and supply schedule below to answer the following questions. Price of Garlic (per...
 Use the demand and supply schedule below to answer the following questions. Price of Garlic (per Quantity of Garlic Quantity of Garlic pound) Demanded Supplied $10 100 20 3080 40 50 60 70 - 40 9020 100 80 a. Graph the demand for garlic and the supply of garlic, and then indicate equilibrium in the garlic market. Instructions: Use the tools provided Supply' and 'Demand' to plot the supply and demand curves for this market (plot 5 points for each...
Consider the market for corn. Suppose the market demand and supply curves are as given. Demand:...
 Consider the market for corn. Suppose the market demand and supply curves are as given. Demand: P = 270-3QD; Supply P = 30 + QS. Price is the price per metric ton (in cents). 1) Calculate the equilibrium price (P) and quantity (Q). 2) If the government impose a price floor of 100 cents per metric ton on corn, calculate the quantity demanded, quantity supplies and the surplus/ shortage at this price.
Suppose we have the following market supply and demand schedules for bicycles: 1.1. Plot the supply curve and the de...
Suppose we have the following market supply and demand schedules for bicycles: 1.1. Plot the supply curve and the demand curve for bicycles. 1.2. What is the equilibrium price of bicycles? 1.3. What is the equilibrium quantity of bicycles? 1.4. If the price of bicycles were $100. Is there a surplus or a shortage? How many units of surplus or shortage are there? Will this cause the price to rise or fall? 1.5. Ifthepriceofbicycleswere$400, is there a surplus or a...
Use the demand and supply schedule below to answer the following questions. Price of Garlic (per...
 Use the demand and supply schedule below to answer the following questions. Price of Garlic (per Quantity of Garlic Quantity of Garlic pound) Demanded Supplied $10 100 20 30 80 40 50 60 70 60 40 20 80 100 90 a. Graph the demand for garlic and the supply of garlic, and then indicate equilibrium in the garlic market Instructions: Use the tools provided 'Supply' and 'Demand' to plot the supply and demand curves for this ma each curve). Use...
Use the demand and supply schedule below to answer the following questions. price of garlic per...
Use the demand and supply schedule below to answer the following questions. price of garlic per pound 10 30 50 70 90 QD of garlic 100 80- 60 40 20 QS of garlic 20 40 60 80 100 a. Graph the demand for garlic and the supply of garlic, and then indicate equilibrium in the garlic market. Instructions: Use the tools provided 'Supply' and 'Demand' to plot the supply and demand curves for this market (plot 5 points for each...
Graphs NOT required! The demand and supply curves for potato chips are: Price Quantity demanded (cents...
 Graphs NOT required! The demand and supply curves for potato chips are: Price Quantity demanded (cents per (millions of bags per bag) week) 180 30 160 140 120 100 20 40 Quantity supplied (millions of bags per week) 160 180 200 220 240 260 280 80 60 a What are the equilibrium price and quantity of chips? (2) b. Calculate the price elasticity of demand from 40 to 80 cents per bag (Show your work). Is demand elastic or inelastic...
The market for cantaloupe has the following demand and supply schedules a. Graph the demand and...
The market for cantaloupe has the following demand and supply schedules a. Graph the demand and supply curves. What is the equilibrium price and quantity in this market? b. What happens, if the price of cantaloupe is $12/t? c. What happens if the price of cantaloupe is $22? Price Quantity demanded Quantity supplied 5 105 25 10 90 50 15 75 75 20 60 100 25 45 125 30 30 150 d. Derive equations for demand and supply curves
DEMAND. SUPPLY, AND MARKET EQUILIBRIUM KEY TERMS change in demand change in quantity demanded change in...
 DEMAND. SUPPLY, AND MARKET EQUILIBRIUM KEY TERMS change in demand change in quantity demanded change in quantity supplied change in supply complements demand schedule excess demand (shortage) excess supply (surplus) individual demand curve Individual supply curve Inferior good law of demand law of supply market demand curve market equilibrium market supply curve minimum supply price normal good perfectly competitive market quantity demanded quantity supplied substitutes supply schedule EXERCISES All problems are assignable in MyEconLab The Demand Curve Describe and explain...
 The following table shows the market demand and supply for soybeans. TABLE DATA: Quantity SuPplied (Bushels per Year) Quantity Demanded (Bushels per Year) Price ($ per Bushel) 10 120 0 110 9 10 8 20 100 7 30 90 6 40 80 5 50 70 4 60 60 3 70 50 2 80 40 1 90 30 0 100 20 Instructions: Enter your responses as a whole number a. What is the equilibrium price? $ per bushel b. What is...
 Question 7 [15 points] The demand and supply for strawberries in Pacifico are as follows: a) Suppose that the supply of strawberries increase by 50 percent. Find the new quantity supplied in the table below. Quantity Demanded Initial Quantity Supplied New Quantity Supplied Price (S) 320 100 120 140 160 180 200 4.25 4.5 4.75 280 260 240 220 200 5.25 5.5 b) What are the equilibrium price and equilibrium quantity for the initial supply? Equilibrium Price$o Equilibrium Quantity c)...
 Use the demand and supply schedule below to answer the following questions. Price of Garlic (per Quantity of Garlic Quantity of Garlic pound) Demanded Supplied $10 100 20 3080 40 50 60 70 - 40 9020 100 80 a. Graph the demand for garlic and the supply of garlic, and then indicate equilibrium in the garlic market. Instructions: Use the tools provided Supply' and 'Demand' to plot the supply and demand curves for this market (plot 5 points for each...
 Consider the market for corn. Suppose the market demand and supply curves are as given. Demand: P = 270-3QD; Supply P = 30 + QS. Price is the price per metric ton (in cents). 1) Calculate the equilibrium price (P) and quantity (Q). 2) If the government impose a price floor of 100 cents per metric ton on corn, calculate the quantity demanded, quantity supplies and the surplus/ shortage at this price.
 Use the demand and supply schedule below to answer the following questions. Price of Garlic (per Quantity of Garlic Quantity of Garlic pound) Demanded Supplied $10 100 20 30 80 40 50 60 70 60 40 20 80 100 90 a. Graph the demand for garlic and the supply of garlic, and then indicate equilibrium in the garlic market Instructions: Use the tools provided 'Supply' and 'Demand' to plot the supply and demand curves for this ma each curve). Use...
 Graphs NOT required! The demand and supply curves for potato chips are: Price Quantity demanded (cents per (millions of bags per bag) week) 180 30 160 140 120 100 20 40 Quantity supplied (millions of bags per week) 160 180 200 220 240 260 280 80 60 a What are the equilibrium price and quantity of chips? (2) b. Calculate the price elasticity of demand from 40 to 80 cents per bag (Show your work). Is demand elastic or inelastic...
 DEMAND. SUPPLY, AND MARKET EQUILIBRIUM KEY TERMS change in demand change in quantity demanded change in quantity supplied change in supply complements demand schedule excess demand (shortage) excess supply (surplus) individual demand curve Individual supply curve Inferior good law of demand law of supply market demand curve market equilibrium market supply curve minimum supply price normal good perfectly competitive market quantity demanded quantity supplied substitutes supply schedule EXERCISES All problems are assignable in MyEconLab The Demand Curve Describe and explain...
Most questions answered within 3 hours.
-
Where is the error in this code sequence?
String s1 = "Hello";
String s2 = "ello";...
asked 10 months ago -
Financial data for Joel de Paris, Inc., for last year
follow:
Joel de Paris, Inc.
Balance...
asked 10 months ago -
Consider this reaction:
Al2(SO4)3 (aq)+ BaCl3
(aq) Al2Cl6 (aq)- +
3BaSO4(s) . What is the...
asked 10 months ago -
Suppose that Savneet is considering increasing her
recent random sample from 20 car rentals to 40...
asked 10 months ago -
Trucks arrive at an unloading terminal at an average rate of 120
per hour.
Trucks arrive...
asked 10 months ago -
Why are methanol and ethanol completely soluble in water while
octanol is not very little soluble....
asked 10 months ago -
A facilities manager at a university reads in a research report
that the mean amount of...
asked 10 months ago -
When the CuSO4 is rehydrated by adding water to the anhydrous
compound, is this an endothermic...
asked 10 months ago -
A ray of sunlight is passing from diamond into crown glass; the
angle of incidence is...
asked 10 months ago -
A block of mass 0.249 kg is placed on top of a light, vertical
spring of...
asked 10 months ago -
how do the kidneys compensate in the presences of acidosis
a) trigger hyperventilate
b) reserve acid...
asked 10 months ago -
Question 501 pts
The rental rate of capital to the firm increases. Which of the
following...
asked 10 months ago