To construct a 96% confidence interval for variance we took a sample of 20 objects. The...
To construct a 96% confidence interval for variance we took a sample of 20 objects. The lower and upper critical values are___and___ , respectively.
Homework Answers


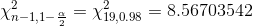

Thus, the critical values are 8.567035 and 33.687425 respectively.
Add Answer to:
To construct a 96% confidence interval for variance we took a
sample of 20 objects. The...
Construct a 96% confidence interval to estimate the population proportion with a sample proportion equal to...
 Construct a 96% confidence interval to estimate the population proportion with a sample proportion equal to 0.36 and a sample size equal to 100. Click the icon to view a portion of the Cumulative Probabilities for the Standard Normal Distribution table A 95% confidence interval estimates that the population proportion is between a lower limit of (Round to three decimal places as needed) and an upper limit of
We wish to create a 96% confidence interval for the proportion. A sample of 34 gives...
We wish to create a 96% confidence interval for the proportion. A sample of 34 gives a proportion of 0.19. Find the lower value for the confidence interval. Round to 3 decimal places.
We wish to create a 90% confidence interval for the Variance given that a sample of...
We wish to create a 90% confidence interval for the Variance given that a sample of 30 has a standard deviation of 3. Find the Lower value for the confidence interval.Round to tenths.
Construct a confidence interval for μ based on the sample data given here: 12.3 11.6 11.9 ...
Construct a confidence interval for μ based on the sample data given here: 12.3 11.6 11.9 12.8 11.5 11.4 12 11.7 11.8 11.5 Use 83% as the confidence level. Round the final values to two digits after the decimal point. The lower limit in the interval is: and the upper limit in the interval is:
If we are constructing a 90% confidence interval for the variance of a population using a...
If we are constructing a 90% confidence interval for the variance of a population using a sample of size 16, the two critical values for chi-square from the table that we need to use are and (use the three decimal place accuracy that the table gives you) wondering if I have to take 16-1 for this question.
Construct a confidence interval for p based on the sample data given here: 12.3 11.6 11.9...
 Construct a confidence interval for p based on the sample data given here: 12.3 11.6 11.9 12.8 11.6 11.4 12 11.7 11.8 12.6 Use 83% as the confidence level. Round the final values to two digits after the decimal point. The lower limit in the interval is: Number and the upper limit in the interval is: Number
Construct a confidence interval for u based on the sample data given here: 12.3 11.6 12.8...
 Construct a confidence interval for u based on the sample data given here: 12.3 11.6 12.8 11.9 11.7 12.1 13.1 11.4 12 11.8 Use 97% as the confidence level. Round the final values to two digits after the decimal point. The lower limit in the interval is: Number and the upper limit in the interval is: Number
Please Help I need the answers to below. Question 2: Construct a 95% confidence interval for...
Please Help I need the answers to below. Question 2: Construct a 95% confidence interval for the population mean. Assume that your data is normally distributed and σ is unknown. Include a statement that correctly interprets the confidence interval in context of the scenario. Calculations/Values Formulas/Answers Mean 72,224.34 Standard Deviation 22,644.46 n 364 Critical Value Margin of Error Lower Limit Upper Limit Question 3 construct a 99% confidence interval for the population mean. Assume that your data is normally distributed...
Construct a 90% confidence interval to estimate the population proportion with a sample proportion equal to...
Construct a 90% confidence interval to estimate the population proportion with a sample proportion equal to 0.44 and a sample size equal to 100. A 90% confidence interval estimates that the population proportion is between a lower limit of blank and an upper limit of. (Round to three decimal places as needed.)
Construct a 99% confidence interval of the population proportion using the given information. x = 40,...
 Construct a 99% confidence interval of the population proportion using the given information. x = 40, n=200 Click here to view the table of critical values. The lower bound is The upper bound is (Round to three decimal places as needed.)
 Construct a 96% confidence interval to estimate the population proportion with a sample proportion equal to 0.36 and a sample size equal to 100. Click the icon to view a portion of the Cumulative Probabilities for the Standard Normal Distribution table A 95% confidence interval estimates that the population proportion is between a lower limit of (Round to three decimal places as needed) and an upper limit of
 Construct a confidence interval for p based on the sample data given here: 12.3 11.6 11.9 12.8 11.6 11.4 12 11.7 11.8 12.6 Use 83% as the confidence level. Round the final values to two digits after the decimal point. The lower limit in the interval is: Number and the upper limit in the interval is: Number
 Construct a confidence interval for u based on the sample data given here: 12.3 11.6 12.8 11.9 11.7 12.1 13.1 11.4 12 11.8 Use 97% as the confidence level. Round the final values to two digits after the decimal point. The lower limit in the interval is: Number and the upper limit in the interval is: Number
 Construct a 99% confidence interval of the population proportion using the given information. x = 40, n=200 Click here to view the table of critical values. The lower bound is The upper bound is (Round to three decimal places as needed.)
Most questions answered within 3 hours.
-
Where is the error in this code sequence?
String s1 = "Hello";
String s2 = "ello";...
asked 10 months ago -
Financial data for Joel de Paris, Inc., for last year
follow:
Joel de Paris, Inc.
Balance...
asked 10 months ago -
Consider this reaction:
Al2(SO4)3 (aq)+ BaCl3
(aq) Al2Cl6 (aq)- +
3BaSO4(s) . What is the...
asked 10 months ago -
Suppose that Savneet is considering increasing her
recent random sample from 20 car rentals to 40...
asked 10 months ago -
Trucks arrive at an unloading terminal at an average rate of 120
per hour.
Trucks arrive...
asked 10 months ago -
Why are methanol and ethanol completely soluble in water while
octanol is not very little soluble....
asked 10 months ago -
A facilities manager at a university reads in a research report
that the mean amount of...
asked 10 months ago -
When the CuSO4 is rehydrated by adding water to the anhydrous
compound, is this an endothermic...
asked 10 months ago -
A ray of sunlight is passing from diamond into crown glass; the
angle of incidence is...
asked 10 months ago -
A block of mass 0.249 kg is placed on top of a light, vertical
spring of...
asked 10 months ago -
how do the kidneys compensate in the presences of acidosis
a) trigger hyperventilate
b) reserve acid...
asked 10 months ago -
Question 501 pts
The rental rate of capital to the firm increases. Which of the
following...
asked 10 months ago