The data table contains waiting times of customers at a bank, where customers enter a single...
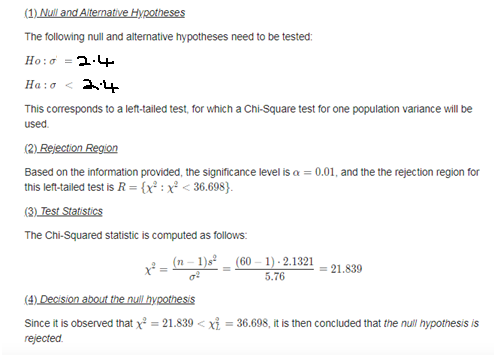
The data table contains waiting times of customers at a bank, where customers enter a single waiting line that feeds three teller windows. Test the claim that the standard deviation of waiting times is less than
2.4
minutes, which is the standard deviation of waiting times at the same bank when separate waiting lines are used at each teller window. Use a significance level of
0.01.
Complete parts (a) through (d) below.
Customer Waiting Times
(in minutes)
7.5
6.5
9.2
6.2
6.2
6.8
7.9
7.7
7.2
6.2
6.4
7.6
7.3
6.4
12.5
6.8
6.8
6.6
13.3
6.6
6.1
6.3
6.6
4.1
6.1
7.4
7.2
6.4
6.7
7.5
7.1
7.8
8.7
7.9
6.5
8.7
6.5
6.5
8.2
7.6
7.6
6.9
10.8
7.9
8.9
6.6
8.3
6.1
9.2
6.6
6.2
6.8
7.5
7.6
6.8
8.9
6.9
7.7
7.5
6.4
Homework Answers
Conclusion
It is concluded that the null hypothesis Ho is rejected. Therefore, there is enough evidence to claim that the standard deviation of waiting times is less than 2.4 at the 0.01 significance level.
Add Answer to:
The data table contains waiting times of customers at a bank,
where customers enter a single...
Waiting times (in minutes) of customers at a bank where all customers enter a single waiting...
Waiting times (in minutes) of customers at a bank where all customers enter a single waiting line and a bank where customers wait in individual lines at three different teller windows are listed below. Find the coefficient of variation for each of the two sets of data, then compare the variation. Bank A (single line): 6.5 nbsp 6.7 nbsp 6.7 nbsp 6.8 nbsp 7.1 nbsp 7.3 nbsp 7.5 nbsp 7.7 nbsp 7.7 nbsp 7.8 Bank B (individual lines): 4.2 nbsp...
The values listed below are waiting times in minutes) of customers at two different banks. At...
 The values listed below are waiting times in minutes) of customers at two different banks. At Bank A, customers enter a single waiting line that feeds three teller windows. At Bank B, customers may enter any one of three different lines that have formed at three teller windows. Answer the following questions. Bank A 6.4 6.6 6.7 6.8 7.1 7.3 7.6 7.7 7.7 Bank B 7.7 4.2 5.4 5.9 6.1 6.6 7.8 7.8 8.5 9.3 10.0 3 Click the icon...
Customer Waiting Times (in minutes) 7.4 6.9 6.9 6.8 7.4 6.6 7.7 6.5 7.2 7.9 8.7...
 Customer Waiting Times (in minutes) 7.4 6.9 6.9 6.8 7.4 6.6 7.7 6.5 7.2 7.9 8.7 7.2 7.4 7.9 6.9 6.7 8.9 7.1 7.6 6.1 7.2 7.6 7.3 5.9 7.3 6.8 6.7 6.9 7.8 7.4 6.8 6.9 6.1 6.4 5.3 7.7 7.7 7.8 7.5 6.3 7.6 7.1 6.9 8.7 7.4 6.4 6.8 7.2 8.6 6.1 7.1 6.7 7.5 7.6 7.1 8.1 7.3 7.5 7.8 6.3 The accompanying data table includes weights (in grams) of a simple random sample of 40...
Saved 2023 A sample of 100 bank customer waiting times are given in the following table:...
 Saved 2023 A sample of 100 bank customer waiting times are given in the following table: Waiting Times (in Minutes) for the Bank Custoner Waiting Tine Case 4.5 9.7 11.8 10.4 4.2 7.e 5.5 8.7 8.8 5.1 5.4 4.5 6.2 3.9 8.7 7.6 4.7 4.0 4.0 10.1 .3 2.8 5.4 6.5 9.7 5.2 7.0 5.8 4.5 8.2 1.9 5.2 4.1 7.9 5.3 8.8 6.2 4.1 4.1 4.5 10.4 .2 7.0 6.8 5.5 8.3 11.3 5.9 8.8 2.8 6.7 5.5 5.e...
The data table contains waiting times of customers at a bank, where customers enter a single...
The data table contains waiting times of customers at a bank, where customers enter a single waiting line that feeds three teller windows. Test the claim that the standard deviation of waiting times is less than 2.2 minutes, which is the standard deviation of waiting times at the same bank when separate waiting lines are used at each teller window. Use a significance level of .05. Complete parts (a) through (d) below Compute the test statistic. Find the p value
The values listed below are waiting times (in minutes) of customers at two different banks. At...
The values listed below are waiting times (in minutes) of customers at two different banks. At Bank A, customers enter a single waiting line that feeds three teller windows. At Bank B, customers may enter any one of three different lines that have formed at three teller windows. Answer the following questions. Bank A 6.5 6.6 6.7 6.8 7.1 7.2 7.5 7.7 7.7 7.7 Bank Upper B 4.2 5.3 5.7 6.3 6.6 7.7 7.7 8.5 9.3 10.0 . Click the...
The data table contains waiting times of customers at a bank, where customers enter a single...
 The
data table contains waiting times of customers at a bank, where
customers enter a single waiting line that feeds three teller
windows. Test the claim that the standard deviation of waiting
times is less than. 1.5 minutes, which is the standard deviation of
waiting times at the same bank when separate waiting lines are used
at each teller window. Use the significance level of 0.025.
Please help with part B and C
C.) find the P value
567-33211653832 676776678676766...
The
data table contains waiting times of customers at a bank, where
customers enter a single waiting line that feeds three teller
windows. Test the claim that the standard deviation of waiting
times is less than. 1.5 minutes, which is the standard deviation of
waiting times at the same bank when separate waiting lines are used
at each teller window. Use the significance level of 0.025.
Please help with part B and C
C.) find the P value
567-33211653832 676776678676766...
number 13 Waiting times (in minutes) of customers at a bank where all customers enter a...
 number 13
Waiting times (in minutes) of customers at a bank where all customers enter a single waiting line and a bank where customers wait in individual lines at three different teller windows are listed below. Find the coefficient of variation for each of the two sets of data, then compare the variation Bank A (single line): 6.6 6.6 6.7 6.7 7.0 7.3 7.3 7.6 7.7 7.7 Bank B (individual 4.1 5.4 5.7 6.1 6.7 7.6 7.7 8.5 9.3 9.9...
number 13
Waiting times (in minutes) of customers at a bank where all customers enter a single waiting line and a bank where customers wait in individual lines at three different teller windows are listed below. Find the coefficient of variation for each of the two sets of data, then compare the variation Bank A (single line): 6.6 6.6 6.7 6.7 7.0 7.3 7.3 7.6 7.7 7.7 Bank B (individual 4.1 5.4 5.7 6.1 6.7 7.6 7.7 8.5 9.3 9.9...
The values listed below are waiting times (in minutes) of customers at two different banks
Bank_A Bank_B 6.4 4.3 6.6 5.5 6.7 5.8 6.8 6.2 7.1 6.7 7.2 7.8 7.6 7.8 7.8 8.4 7.8 9.4 7.8 10 The values listed below are waiting times (in minutes) of customers at two different banks. At Bank A, customers enter a single waiting line that feeds three teller windows. At Bank B, customers may enter any one of three different lines that have formed at three teller windows. Answer the following questions.Constructaa9999%confidence interval for the population standard deviationsigmaσat Bank A.nothingminless than<sigma Subscript Bank Upper AσBank Aless than< nothingmin(Round to...
The data table contains waiting times of customers at a bank, where customers enter a single waiting line that feeds three teller windows
The data table contains waiting times of customers at a bank, where customers enter a single waiting line that feeds three teller windows. Test the claim that the standard deviation of waiting times is less than 2.2 minutes, which is the standard deviation of waiting times at the same bank when separate waiting lines are used at each teller window. Use a significance level of .05. Complete parts (a) through (d) below Compute the test statistic. Find the p-value.
 The values listed below are waiting times in minutes) of customers at two different banks. At Bank A, customers enter a single waiting line that feeds three teller windows. At Bank B, customers may enter any one of three different lines that have formed at three teller windows. Answer the following questions. Bank A 6.4 6.6 6.7 6.8 7.1 7.3 7.6 7.7 7.7 Bank B 7.7 4.2 5.4 5.9 6.1 6.6 7.8 7.8 8.5 9.3 10.0 3 Click the icon...
 Customer Waiting Times (in minutes) 7.4 6.9 6.9 6.8 7.4 6.6 7.7 6.5 7.2 7.9 8.7 7.2 7.4 7.9 6.9 6.7 8.9 7.1 7.6 6.1 7.2 7.6 7.3 5.9 7.3 6.8 6.7 6.9 7.8 7.4 6.8 6.9 6.1 6.4 5.3 7.7 7.7 7.8 7.5 6.3 7.6 7.1 6.9 8.7 7.4 6.4 6.8 7.2 8.6 6.1 7.1 6.7 7.5 7.6 7.1 8.1 7.3 7.5 7.8 6.3 The accompanying data table includes weights (in grams) of a simple random sample of 40...
 Saved 2023 A sample of 100 bank customer waiting times are given in the following table: Waiting Times (in Minutes) for the Bank Custoner Waiting Tine Case 4.5 9.7 11.8 10.4 4.2 7.e 5.5 8.7 8.8 5.1 5.4 4.5 6.2 3.9 8.7 7.6 4.7 4.0 4.0 10.1 .3 2.8 5.4 6.5 9.7 5.2 7.0 5.8 4.5 8.2 1.9 5.2 4.1 7.9 5.3 8.8 6.2 4.1 4.1 4.5 10.4 .2 7.0 6.8 5.5 8.3 11.3 5.9 8.8 2.8 6.7 5.5 5.e...
 The
data table contains waiting times of customers at a bank, where
customers enter a single waiting line that feeds three teller
windows. Test the claim that the standard deviation of waiting
times is less than. 1.5 minutes, which is the standard deviation of
waiting times at the same bank when separate waiting lines are used
at each teller window. Use the significance level of 0.025.
Please help with part B and C
C.) find the P value
567-33211653832 676776678676766...
The
data table contains waiting times of customers at a bank, where
customers enter a single waiting line that feeds three teller
windows. Test the claim that the standard deviation of waiting
times is less than. 1.5 minutes, which is the standard deviation of
waiting times at the same bank when separate waiting lines are used
at each teller window. Use the significance level of 0.025.
Please help with part B and C
C.) find the P value
567-33211653832 676776678676766...
 number 13
Waiting times (in minutes) of customers at a bank where all customers enter a single waiting line and a bank where customers wait in individual lines at three different teller windows are listed below. Find the coefficient of variation for each of the two sets of data, then compare the variation Bank A (single line): 6.6 6.6 6.7 6.7 7.0 7.3 7.3 7.6 7.7 7.7 Bank B (individual 4.1 5.4 5.7 6.1 6.7 7.6 7.7 8.5 9.3 9.9...
number 13
Waiting times (in minutes) of customers at a bank where all customers enter a single waiting line and a bank where customers wait in individual lines at three different teller windows are listed below. Find the coefficient of variation for each of the two sets of data, then compare the variation Bank A (single line): 6.6 6.6 6.7 6.7 7.0 7.3 7.3 7.6 7.7 7.7 Bank B (individual 4.1 5.4 5.7 6.1 6.7 7.6 7.7 8.5 9.3 9.9...
Most questions answered within 3 hours.
-
Where is the error in this code sequence?
String s1 = "Hello";
String s2 = "ello";...
asked 10 months ago -
Financial data for Joel de Paris, Inc., for last year
follow:
Joel de Paris, Inc.
Balance...
asked 10 months ago -
Consider this reaction:
Al2(SO4)3 (aq)+ BaCl3
(aq) Al2Cl6 (aq)- +
3BaSO4(s) . What is the...
asked 10 months ago -
Suppose that Savneet is considering increasing her
recent random sample from 20 car rentals to 40...
asked 10 months ago -
Trucks arrive at an unloading terminal at an average rate of 120
per hour.
Trucks arrive...
asked 10 months ago -
Why are methanol and ethanol completely soluble in water while
octanol is not very little soluble....
asked 10 months ago -
A facilities manager at a university reads in a research report
that the mean amount of...
asked 10 months ago -
When the CuSO4 is rehydrated by adding water to the anhydrous
compound, is this an endothermic...
asked 10 months ago -
A ray of sunlight is passing from diamond into crown glass; the
angle of incidence is...
asked 10 months ago -
A block of mass 0.249 kg is placed on top of a light, vertical
spring of...
asked 10 months ago -
how do the kidneys compensate in the presences of acidosis
a) trigger hyperventilate
b) reserve acid...
asked 10 months ago -
Question 501 pts
The rental rate of capital to the firm increases. Which of the
following...
asked 10 months ago