


Homework Answers
Hope this solution will help you to understand. If you are satisfied with the answer then please please give a like to this answer. Thank you.
Add Answer to:
Find the equation of the regression line for the given data. Then construct a scatter plot...
Find the equation of the regression line for the given data. Then construct a scatter plot...
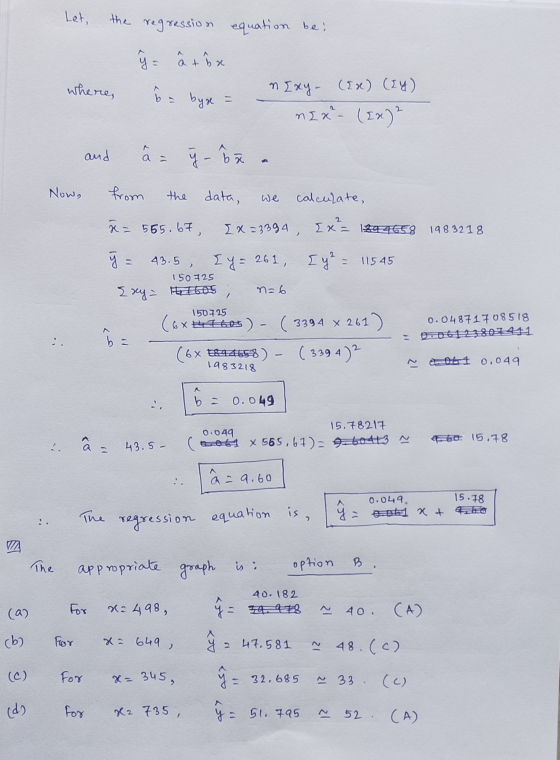
 Find the equation of the regression line for the given data. Then construct a scatter plot of the given x-values, if meaningful. The table below shows the heights (in feet) and the number of stories of Height, Stories, y data and draw the regression line. (The pair of variables have a signiicant correlation.) Then use the regression equation to predict the value of y for each of the sb. notable buildings in a city 775 53 619 47 519 46...
Find the equation of the regression line for the given data. Then construct a scatter plot...
Find the equation of the regression line for the given data. Then construct a scatter plot of the data and draw the regression line. (The pair of variables have a significant correlation.) Then use the regression equation to predict the value of y for each of the given x-values, if meaningful. The table below shows the heights (in feet) and the number of stories of six notable buildings in a city. Height comma xHeight, x 764 625 520 510 492...
519 Find the equation of the regression line for the given data. Then construct a scatter...
 519 Find the equation of the regression line for the given data. Then construct a scatter plot of the data and draw the regression line. (The pair of variables have a significant correlation.) Then use the regression equation to predict the value of y for each of the given x-values, if meaningful The table below shows the heights (in feet) and the number of stories of six notable buildings in a city Height, 778 621 510 494 473 (a) x...
Find the equation of the regression line for the given data. Then construct a scatter plot...
 Find the equation of the regression line for the given data. Then construct a scatter plot of the data and draw the regression line. (The pair of variaties have a significant correlation) Then use the regression equation to predict the value of yo each of the given x-values, if meaningful. The table below shows the height in feet) and the number of stories of six notable buildings in a city Heights 772 5110 503 483 Stories 51 (a)x= 501 foot...
0 Find the equation of the regression line for the given data. The construct a scatter...
 0 Find the equation of the regression line for the given data. The construct a scatter plot of the date and draw the regression in (The pair of we have a significant corelation) Then use the regression equation to predict the value ofy for each of the given x-vous meaningful. The table below shows the heights on tool and the number of stories of si notable buildings in a city Helght, 775 510 500 (0) 500 fot b)x500 Stories 37...
Find the equation of the regression line for the given data. Then construct a scater plot...
 Find the equation of the regression line for the given data. Then construct a scater plot of the data and draw the regression line (The pair of variubles have a significant comelation) Then use the regression equation to predict the vakue of y for each of the given x-values, if meaningul The table below shows the heights (in feet) and the number of shories of six notable buildings in a city 758 Height, K Stories, y 621 47 (a)490 feet...
Find the equation of the regression line for the given data. Then construct a scatter plot...
 Find the equation of the regression line for the given data. Then construct a scatter plot of the data and draw the regression line. (The pair of variables has a significant correlation.) Then use the regressiorn equation to predict the value of y for each of the given x-values, if meaningful. The table shows the shoe size and heights (in) for 6 men Shoe size: x-T8.5 110T15|130|135 (a) x=size 10 0 (b)x-size 10.5 3.5 745 725(c)x-s size 16.0 (d)x- size...
Find the equation of the regression line for the given data. Then construct a scatter plot...
 Find the equation of the regression line for the given data. Then construct a scatter plot of the data and draw the regression line. (The pair of variables have a significant correlation.) Then use the regression equation to predict the value of y for each of the given x-values, if meaningful. The number of hours 6 students spent for a test and their scores on that test are shown below. Hours spent studying, X 2 5 5 (a) x =...
Find the equation of the regression line for the given data. Then construct a scatter plot...
 Find the equation of the regression line for the given data.
Then construct a scatter plot of the data and draw the regression
line. (The pair of variables have a significant correlation.) Then
use the regression equation to predict the value of y for each of
the given x-values, if meaningful. The number of hours 6 students
spent for a test and their scores on that test are shown below.
(a)
x=3hours
(b)
x=4.5hours
(c)
x=14hours
(d)
x=2.5hour
Find the...
Find the equation of the regression line for the given data.
Then construct a scatter plot of the data and draw the regression
line. (The pair of variables have a significant correlation.) Then
use the regression equation to predict the value of y for each of
the given x-values, if meaningful. The number of hours 6 students
spent for a test and their scores on that test are shown below.
(a)
x=3hours
(b)
x=4.5hours
(c)
x=14hours
(d)
x=2.5hour
Find the...
Find the equation of the regression line for the given data. Then construct a scatter plot...
 Find the equation of the regression line for the given data. Then construct a scatter plot of the data and draw the regression line. (The pair of variables have a significa correlation.) Then use the regression equation to predict the value of y for each of the given x-values, if meaningful. The table below shows the heights (in feet) and the number of stories of six notable buildings in a city. Height, x 758 621 518 510 492 483 (a)...
 Find the equation of the regression line for the given data. Then construct a scatter plot of the given x-values, if meaningful. The table below shows the heights (in feet) and the number of stories of Height, Stories, y data and draw the regression line. (The pair of variables have a signiicant correlation.) Then use the regression equation to predict the value of y for each of the sb. notable buildings in a city 775 53 619 47 519 46...
 519 Find the equation of the regression line for the given data. Then construct a scatter plot of the data and draw the regression line. (The pair of variables have a significant correlation.) Then use the regression equation to predict the value of y for each of the given x-values, if meaningful The table below shows the heights (in feet) and the number of stories of six notable buildings in a city Height, 778 621 510 494 473 (a) x...
 Find the equation of the regression line for the given data. Then construct a scatter plot of the data and draw the regression line. (The pair of variaties have a significant correlation) Then use the regression equation to predict the value of yo each of the given x-values, if meaningful. The table below shows the height in feet) and the number of stories of six notable buildings in a city Heights 772 5110 503 483 Stories 51 (a)x= 501 foot...
 0 Find the equation of the regression line for the given data. The construct a scatter plot of the date and draw the regression in (The pair of we have a significant corelation) Then use the regression equation to predict the value ofy for each of the given x-vous meaningful. The table below shows the heights on tool and the number of stories of si notable buildings in a city Helght, 775 510 500 (0) 500 fot b)x500 Stories 37...
 Find the equation of the regression line for the given data. Then construct a scater plot of the data and draw the regression line (The pair of variubles have a significant comelation) Then use the regression equation to predict the vakue of y for each of the given x-values, if meaningul The table below shows the heights (in feet) and the number of shories of six notable buildings in a city 758 Height, K Stories, y 621 47 (a)490 feet...
 Find the equation of the regression line for the given data. Then construct a scatter plot of the data and draw the regression line. (The pair of variables has a significant correlation.) Then use the regressiorn equation to predict the value of y for each of the given x-values, if meaningful. The table shows the shoe size and heights (in) for 6 men Shoe size: x-T8.5 110T15|130|135 (a) x=size 10 0 (b)x-size 10.5 3.5 745 725(c)x-s size 16.0 (d)x- size...
 Find the equation of the regression line for the given data. Then construct a scatter plot of the data and draw the regression line. (The pair of variables have a significant correlation.) Then use the regression equation to predict the value of y for each of the given x-values, if meaningful. The number of hours 6 students spent for a test and their scores on that test are shown below. Hours spent studying, X 2 5 5 (a) x =...
 Find the equation of the regression line for the given data.
Then construct a scatter plot of the data and draw the regression
line. (The pair of variables have a significant correlation.) Then
use the regression equation to predict the value of y for each of
the given x-values, if meaningful. The number of hours 6 students
spent for a test and their scores on that test are shown below.
(a)
x=3hours
(b)
x=4.5hours
(c)
x=14hours
(d)
x=2.5hour
Find the...
Find the equation of the regression line for the given data.
Then construct a scatter plot of the data and draw the regression
line. (The pair of variables have a significant correlation.) Then
use the regression equation to predict the value of y for each of
the given x-values, if meaningful. The number of hours 6 students
spent for a test and their scores on that test are shown below.
(a)
x=3hours
(b)
x=4.5hours
(c)
x=14hours
(d)
x=2.5hour
Find the...
 Find the equation of the regression line for the given data. Then construct a scatter plot of the data and draw the regression line. (The pair of variables have a significa correlation.) Then use the regression equation to predict the value of y for each of the given x-values, if meaningful. The table below shows the heights (in feet) and the number of stories of six notable buildings in a city. Height, x 758 621 518 510 492 483 (a)...
Most questions answered within 3 hours.
-
Where is the error in this code sequence?
String s1 = "Hello";
String s2 = "ello";...
asked 11 months ago -
Financial data for Joel de Paris, Inc., for last year
follow:
Joel de Paris, Inc.
Balance...
asked 11 months ago -
Consider this reaction:
Al2(SO4)3 (aq)+ BaCl3
(aq) Al2Cl6 (aq)- +
3BaSO4(s) . What is the...
asked 11 months ago -
Suppose that Savneet is considering increasing her
recent random sample from 20 car rentals to 40...
asked 11 months ago -
Trucks arrive at an unloading terminal at an average rate of 120
per hour.
Trucks arrive...
asked 11 months ago -
Why are methanol and ethanol completely soluble in water while
octanol is not very little soluble....
asked 11 months ago -
A facilities manager at a university reads in a research report
that the mean amount of...
asked 11 months ago -
When the CuSO4 is rehydrated by adding water to the anhydrous
compound, is this an endothermic...
asked 11 months ago -
A ray of sunlight is passing from diamond into crown glass; the
angle of incidence is...
asked 11 months ago -
A block of mass 0.249 kg is placed on top of a light, vertical
spring of...
asked 11 months ago -
how do the kidneys compensate in the presences of acidosis
a) trigger hyperventilate
b) reserve acid...
asked 11 months ago -
Question 501 pts
The rental rate of capital to the firm increases. Which of the
following...
asked 11 months ago