A vending machine company wants to check three of its machines to determine if they are...
A vending machine company wants to check three of its machines to determine if they are properly dispensing 12 ounces of coffee. Test by using α = 0.05. Their data is given below.
| Machine A | Machine B | Machine C |
|
11.8 |
11.7 | 12.2 |
| 12.1 | 11.9 | 12.1 |
| 12.0 | 11.7 | 12.0 |
| 11.9 | 11.8 | 11.9 |
| 12.1 | 12.0 | 12.2 |
A. There is sufficient evidence to reject the claim that the proportions are equal because the p-value 0.0255 < 0.05
B. There is insufficient evidence to conclude the claim that the proportions are equal because the p-value 0.0255 < 0.05
C. There is insufficient evidence to reject the claim that the proportions are equal because the p-value 0.0255 < 0.05
D. There is sufficient evidence to conclude the claim that the proportions are equal because the p-value 0.0255 < 0.05
Homework Answers
The statistical software output for this problem is :
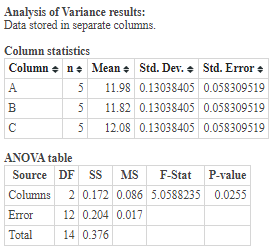
D. There is sufficient evidence to conclude the claim that the proportions are equal because the p-value 0.0255 < 0.05
Add Answer to:
A vending machine company wants to check three of its machines
to determine if they are...
1. A vending machine that dispenses coffee into cups must fill the cups with 7.8 oz...
 1. A vending machine that dispenses coffee into cups must fill the cups with 7.8 oz of liquid. Before selling the vending machine to a college or business, the company tests the machine to be sure it is dispensing an average amount of 7.8 oz of coffee. A sample of 20 amounts is shown here. Assume that the amount of coffee dispensed is normally distributed. 7.78 7.79 7.82 7.82 7.87 7.84 Ounces Dispensed 7.80 7.80 7.83 7.85 7.82 7.78 7.75...
A certain vending company's soft-drink dispensing machines are supposed to serve 6 oz of beverage. Various...
A certain vending company's soft-drink dispensing machines are supposed to serve 6 oz of beverage. Various machines were sampled, and the resulting amounts of dispensed drink (in ounces) were recorded, as shown in the following table. Does this sample evidence provide sufficient reason to reject the null hypothesis that all five machines dispense the same average amount of soft drink? Use α= .01? Machines A B C D E 4.1 7.2 4.0 6.3 5.7 3.8...
A machine in the student lounge dispenses coffee. The average cup of coffee is supposed to contai...
A machine in the student lounge dispenses coffee. The average cup of coffee is supposed to contain 7.0 ounces. A random sample of eight cups of coffee from this machine show the average content to be 7.4 ounces with a standard deviation of 0.70 ounce. Do you think that the machine has slipped out of adjustment and that the average amount of coffee per cup is different from 7 ounces? Use a 5% level of significance. What are we testing...
The table to the right contains observed values and expected values in parentheses for two categorical...
 The table to the right contains observed values and expected values in parentheses for two categorical variables, X and Y, where variable X has three categories and variable Y has two categories. Use the table to complete parts (a) and (b) below. Y1 X1 X3 32 45 49 (32.72) (47.34) (45.94) 15 23 17 (14.28) 20.66) (20.06) Y2 (a) Compute the value of the chi-square test statistic. x=(Round to three decimal places as needed.) (b) Test the hypothesis that X...
A machine that puts corn flakes into boxes is adjusted to put an average of 15.8...
A machine that puts corn flakes into boxes is adjusted to put an average of 15.8 ounces into each box, with standard deviation of 0.22 ounce. If a random sample of 10 boxes gave a sample standard deviation of 0.39 ounce, do these data support the claim that the variance has increased and the machine needs to be brought back into adjustment? (Use a 0.01 level of significance.) (i) Give the value of the level of significance. State the null...
A bottled water distributor wants to determine whether the mean amount of water contained in 1-gallon bottles purchased from a nationally known water bottling company is actually 1 gallon. You know f...
 A bottled water distributor wants to determine whether the mean amount of water contained in 1-gallon bottles purchased from a nationally known water bottling company is actually 1 gallon. You know from the water bottling company specifications that the standard deviation of the amount of water is 0.02 gallon. You select a random sample of 45 bottles, and the mean amount of water per 1-gallon bottle is 0.994 gallon. Complete parts (a) through (d) below. a. Is there evidence that...
To test whether the mean time needed to mix a batch of material is the same for machines produced by three manufacturers...
 To test whether the mean time needed to mix a batch of material
is the same for machines produced by three manufacturers, a
chemical company obtained the following data on the time (in
minutes) needed to mix the material.
Manufacturer
1
2
3
20
28
20
25
25
18
24
32
24
27
27
18
(a)
Use these data to test whether the population mean times for
mixing a batch of material differ for the three manufacturers.
Use
α =...
To test whether the mean time needed to mix a batch of material
is the same for machines produced by three manufacturers, a
chemical company obtained the following data on the time (in
minutes) needed to mix the material.
Manufacturer
1
2
3
20
28
20
25
25
18
24
32
24
27
27
18
(a)
Use these data to test whether the population mean times for
mixing a batch of material differ for the three manufacturers.
Use
α =...
According to a magazine, people read an average of more than three books in a month....
According to a magazine, people read an average of more than three books in a month. A survey of 30 random individuals found that the mean number of books they read was 3.2 with a standard deviation of 1.26. a. To test the magazine's claim, what should the appropriate hypotheses be? b. Compute the test statistic. c. Using a level of significance of 0.05, what is the critical value? d. Find the p-value for the test. e. What is your...
Historically, the proportions of all Caucasians in the United States with blood phenotypes A, B, AB, and O are 0.41, 0.10, 0.04, and 0.45, respectively. To determine whether current population pr...
 Historically, the proportions of all Caucasians in the United States with blood phenotypes A, B, AB, and O are 0.41, 0.10, 0.04, and 0.45, respectively. To determine whether current population proportions still match these historical values, a random sample of 200 American Caucasians were selected, and their blood phenotypes were recorded. The observed numbers with each phenotype are given in the following table. 8817 13 2 (a) Is there sufficient evidence, at the 0.05 level of significance, to claim that...
A company produces a single product on three production lines that use different equipment. The production...
 A company produces a single product on three production lines
that use different equipment. The production manager is considering
changing the layouts of the lines and would like to know what
effects different layouts would have on production output. Suppose
that the manager measured the average output for each line over
three randomly selected weeks using each of the three layouts under
consideration. The output (in hundreds of units produced) was
measured for each line for each of the four...
A company produces a single product on three production lines
that use different equipment. The production manager is considering
changing the layouts of the lines and would like to know what
effects different layouts would have on production output. Suppose
that the manager measured the average output for each line over
three randomly selected weeks using each of the three layouts under
consideration. The output (in hundreds of units produced) was
measured for each line for each of the four...
 1. A vending machine that dispenses coffee into cups must fill the cups with 7.8 oz of liquid. Before selling the vending machine to a college or business, the company tests the machine to be sure it is dispensing an average amount of 7.8 oz of coffee. A sample of 20 amounts is shown here. Assume that the amount of coffee dispensed is normally distributed. 7.78 7.79 7.82 7.82 7.87 7.84 Ounces Dispensed 7.80 7.80 7.83 7.85 7.82 7.78 7.75...
 The table to the right contains observed values and expected values in parentheses for two categorical variables, X and Y, where variable X has three categories and variable Y has two categories. Use the table to complete parts (a) and (b) below. Y1 X1 X3 32 45 49 (32.72) (47.34) (45.94) 15 23 17 (14.28) 20.66) (20.06) Y2 (a) Compute the value of the chi-square test statistic. x=(Round to three decimal places as needed.) (b) Test the hypothesis that X...
 A bottled water distributor wants to determine whether the mean amount of water contained in 1-gallon bottles purchased from a nationally known water bottling company is actually 1 gallon. You know from the water bottling company specifications that the standard deviation of the amount of water is 0.02 gallon. You select a random sample of 45 bottles, and the mean amount of water per 1-gallon bottle is 0.994 gallon. Complete parts (a) through (d) below. a. Is there evidence that...
 To test whether the mean time needed to mix a batch of material
is the same for machines produced by three manufacturers, a
chemical company obtained the following data on the time (in
minutes) needed to mix the material.
Manufacturer
1
2
3
20
28
20
25
25
18
24
32
24
27
27
18
(a)
Use these data to test whether the population mean times for
mixing a batch of material differ for the three manufacturers.
Use
α =...
To test whether the mean time needed to mix a batch of material
is the same for machines produced by three manufacturers, a
chemical company obtained the following data on the time (in
minutes) needed to mix the material.
Manufacturer
1
2
3
20
28
20
25
25
18
24
32
24
27
27
18
(a)
Use these data to test whether the population mean times for
mixing a batch of material differ for the three manufacturers.
Use
α =...
 Historically, the proportions of all Caucasians in the United States with blood phenotypes A, B, AB, and O are 0.41, 0.10, 0.04, and 0.45, respectively. To determine whether current population proportions still match these historical values, a random sample of 200 American Caucasians were selected, and their blood phenotypes were recorded. The observed numbers with each phenotype are given in the following table. 8817 13 2 (a) Is there sufficient evidence, at the 0.05 level of significance, to claim that...
 A company produces a single product on three production lines
that use different equipment. The production manager is considering
changing the layouts of the lines and would like to know what
effects different layouts would have on production output. Suppose
that the manager measured the average output for each line over
three randomly selected weeks using each of the three layouts under
consideration. The output (in hundreds of units produced) was
measured for each line for each of the four...
A company produces a single product on three production lines
that use different equipment. The production manager is considering
changing the layouts of the lines and would like to know what
effects different layouts would have on production output. Suppose
that the manager measured the average output for each line over
three randomly selected weeks using each of the three layouts under
consideration. The output (in hundreds of units produced) was
measured for each line for each of the four...
Most questions answered within 3 hours.
-
Where is the error in this code sequence?
String s1 = "Hello";
String s2 = "ello";...
asked 11 months ago -
Financial data for Joel de Paris, Inc., for last year
follow:
Joel de Paris, Inc.
Balance...
asked 11 months ago -
Consider this reaction:
Al2(SO4)3 (aq)+ BaCl3
(aq) Al2Cl6 (aq)- +
3BaSO4(s) . What is the...
asked 11 months ago -
Suppose that Savneet is considering increasing her
recent random sample from 20 car rentals to 40...
asked 11 months ago -
Trucks arrive at an unloading terminal at an average rate of 120
per hour.
Trucks arrive...
asked 11 months ago -
Why are methanol and ethanol completely soluble in water while
octanol is not very little soluble....
asked 11 months ago -
A facilities manager at a university reads in a research report
that the mean amount of...
asked 11 months ago -
When the CuSO4 is rehydrated by adding water to the anhydrous
compound, is this an endothermic...
asked 11 months ago -
A ray of sunlight is passing from diamond into crown glass; the
angle of incidence is...
asked 11 months ago -
A block of mass 0.249 kg is placed on top of a light, vertical
spring of...
asked 11 months ago -
how do the kidneys compensate in the presences of acidosis
a) trigger hyperventilate
b) reserve acid...
asked 11 months ago -
Question 501 pts
The rental rate of capital to the firm increases. Which of the
following...
asked 11 months ago