
Homework Answers

Add Answer to:
3. The data in the table to the right are based on the results of a...
2. The data in the table to the right are based on the results of a...
 2. The data in the table to the right are based on the results of a survey comparing the commute time of adults to their score on a well-being test. Determine the linear correlation coefficient between commute time and well-being score. Round your answer to three decimal places. Commute Timelin minutes) Well-Being Score 13 72 15 71 20 70 30 69 40 67 50 65 60 63
The data in the table to the right are based on the results of a survey...
The data in the table to the right are based on the results of a survey comparing the commute time of adults to their score on a well-being test. Draw a scatter diagram of the data. Does a linear relation exist between the commute time and well-being index score, when the linear correlation coefficient is -0.991? Commute Time (in minutes) Well-Being Score 4 69.2 16 68.9 23 67.9 34 67.7 53 66.3 74 65.2 95 63.1.
6). a.b.b. The data in the table to the right are based on the results of...
 6).
a.b.b.
The data in the table to the right are based on the results of a survey comparing the commute time of adults to their score on a well-being test. Complete parts (a) through (d) below. Click the icon to view the critical values for the correlation coefficient. Commute Time (in minutes) Well-Being Score 5 69.5 16 68.9 27 67.5 34 67.4 47 66.9 68 65.9 97 63.9 (a) Which variable is likely the explanatory variable and which is...
6).
a.b.b.
The data in the table to the right are based on the results of a survey comparing the commute time of adults to their score on a well-being test. Complete parts (a) through (d) below. Click the icon to view the critical values for the correlation coefficient. Commute Time (in minutes) Well-Being Score 5 69.5 16 68.9 27 67.5 34 67.4 47 66.9 68 65.9 97 63.9 (a) Which variable is likely the explanatory variable and which is...
The data in the table to the right are based on the results of a survey...
 The data in the table to the right are based on the results of a survey comparing the commute time of adults to their score on a well-being test. Complete parts (a) through (d) below. Click the icon to view the critical values for the correlation coefficient Commute Time (in minutes) Well Being Score 5 69.5 14 68.5 23 67.9 37 67.4 48 66.5 65 65.2 103 63.2 (a) Which variable is likely the explanatory variable and which is the...
Draw a scatter diagram of the data. Which of the following represents the data? OA OB...
 Draw a scatter diagram of the data. Which of the following
represents the data?
OA OB O C. Ο D. 110 110 60 70 110 110 Critical Values for Correlation Coefficient 3 0.997 4 0.950 5 0.878 辟稳ぷ2 11 7 0.754 8 0.707 9 0.666 10 0.632 11 0.602 12 0.576 13 0.553 The data in the table to the right are based on the results of a survey comparing the commute time of adults to Commute their score on...
Draw a scatter diagram of the data. Which of the following
represents the data?
OA OB O C. Ο D. 110 110 60 70 110 110 Critical Values for Correlation Coefficient 3 0.997 4 0.950 5 0.878 辟稳ぷ2 11 7 0.754 8 0.707 9 0.666 10 0.632 11 0.602 12 0.576 13 0.553 The data in the table to the right are based on the results of a survey comparing the commute time of adults to Commute their score on...
3. Outliers: For the “Height in Inches” data, compute a z-score for each record and create...
3. Outliers: For the “Height in Inches” data, compute a z-score for each record and create a histogram of the transformed data (test different bin widths). What percentage of z-scores lie between -1 and 1? Between -2 and 2? Between -3 and 3? Do the data correspond to the expected features of a “symmetric-mound shaped distribution”? HEIGHT DATA 67 67 68 68 74 69 71 66 64 64 66 68 68 72 72 67 67 66 67 69 71...
Consider the below matrixA, which you can copy and paste directly into Matlab.
Problem #1: Consider the below matrix A, which you can copy and paste directly into Matlab. The matrix contains 3 columns. The first column consists of Test #1 marks, the second column is Test # 2 marks, and the third column is final exam marks for a large linear algebra course. Each row represents a particular student.A = [36 45 75 81 59 73 77 73 73 65 72 78 65 55 83 73 57 78 84 31 60 83...
Problem 4: Variables that may affect Grades The data set contains a random sample of STAT 250 Final Exam Scores out of 80 points. For each individual sampled, the time (in hours per week) that the stu...
Problem 4: Variables that may affect Grades The data set contains a random sample of STAT 250 Final Exam Scores out of 80 points. For each individual sampled, the time (in hours per week) that the student spent participating in a GMU club or sport and working for pay outside of GMU was recorded. Values of 0 indicate the students either does not participate in a club or sport or does not work a job for pay. The goal of...
The data below represent commute times (in minutes) and scores on a well-being survey. Commute Time...
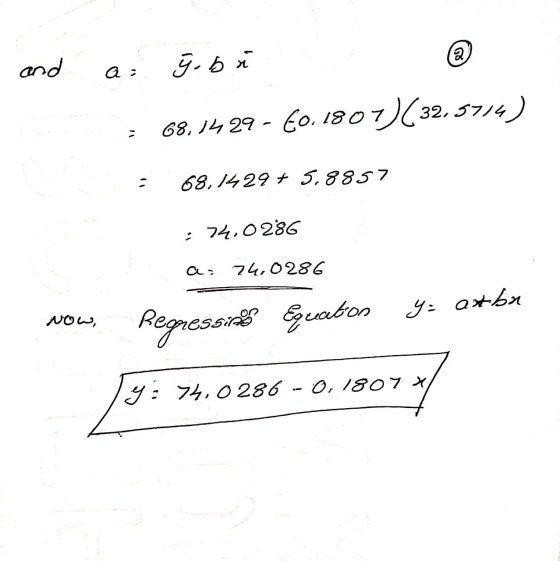
The data below represent commute times (in minutes) and scores on a well-being survey. Commute Time (minutes), x 5 20 25 40 50 84 105 Well-Being Index Score, y 69.2 68.0 67.4 66.6 66.2 65.1 63.3 Given that r = -0.9841, Sx = 35.981, Sy = 1.942. a) Find the equation for the regression line. b) Interpret the slope and y-intercept. c) Find the predicted value of index score when x = 40. Find the residual for the value of...
estimate the average age at which multiple sclerosis patients were diagnosed with the condition for the...
estimate the average age at which multiple sclerosis patients were diagnosed with the condition for the first time in a given city. How big should the sample be? Define your procedures for this estimate (if necessary, set your own values of unknown parameters, based on statistical theory). In Table 1 you will find all ages of this patient population. 54 58 56 48 62 59 55 56 60 52 53 61 56 56 53 37 71 62 39 61 54...
 2. The data in the table to the right are based on the results of a survey comparing the commute time of adults to their score on a well-being test. Determine the linear correlation coefficient between commute time and well-being score. Round your answer to three decimal places. Commute Timelin minutes) Well-Being Score 13 72 15 71 20 70 30 69 40 67 50 65 60 63
 6).
a.b.b.
The data in the table to the right are based on the results of a survey comparing the commute time of adults to their score on a well-being test. Complete parts (a) through (d) below. Click the icon to view the critical values for the correlation coefficient. Commute Time (in minutes) Well-Being Score 5 69.5 16 68.9 27 67.5 34 67.4 47 66.9 68 65.9 97 63.9 (a) Which variable is likely the explanatory variable and which is...
6).
a.b.b.
The data in the table to the right are based on the results of a survey comparing the commute time of adults to their score on a well-being test. Complete parts (a) through (d) below. Click the icon to view the critical values for the correlation coefficient. Commute Time (in minutes) Well-Being Score 5 69.5 16 68.9 27 67.5 34 67.4 47 66.9 68 65.9 97 63.9 (a) Which variable is likely the explanatory variable and which is...
 The data in the table to the right are based on the results of a survey comparing the commute time of adults to their score on a well-being test. Complete parts (a) through (d) below. Click the icon to view the critical values for the correlation coefficient Commute Time (in minutes) Well Being Score 5 69.5 14 68.5 23 67.9 37 67.4 48 66.5 65 65.2 103 63.2 (a) Which variable is likely the explanatory variable and which is the...
 Draw a scatter diagram of the data. Which of the following
represents the data?
OA OB O C. Ο D. 110 110 60 70 110 110 Critical Values for Correlation Coefficient 3 0.997 4 0.950 5 0.878 辟稳ぷ2 11 7 0.754 8 0.707 9 0.666 10 0.632 11 0.602 12 0.576 13 0.553 The data in the table to the right are based on the results of a survey comparing the commute time of adults to Commute their score on...
Draw a scatter diagram of the data. Which of the following
represents the data?
OA OB O C. Ο D. 110 110 60 70 110 110 Critical Values for Correlation Coefficient 3 0.997 4 0.950 5 0.878 辟稳ぷ2 11 7 0.754 8 0.707 9 0.666 10 0.632 11 0.602 12 0.576 13 0.553 The data in the table to the right are based on the results of a survey comparing the commute time of adults to Commute their score on...
Most questions answered within 3 hours.
-
Where is the error in this code sequence?
String s1 = "Hello";
String s2 = "ello";...
asked 10 months ago -
Financial data for Joel de Paris, Inc., for last year
follow:
Joel de Paris, Inc.
Balance...
asked 10 months ago -
Consider this reaction:
Al2(SO4)3 (aq)+ BaCl3
(aq) Al2Cl6 (aq)- +
3BaSO4(s) . What is the...
asked 10 months ago -
Suppose that Savneet is considering increasing her
recent random sample from 20 car rentals to 40...
asked 10 months ago -
Trucks arrive at an unloading terminal at an average rate of 120
per hour.
Trucks arrive...
asked 10 months ago -
Why are methanol and ethanol completely soluble in water while
octanol is not very little soluble....
asked 10 months ago -
A facilities manager at a university reads in a research report
that the mean amount of...
asked 10 months ago -
When the CuSO4 is rehydrated by adding water to the anhydrous
compound, is this an endothermic...
asked 10 months ago -
A ray of sunlight is passing from diamond into crown glass; the
angle of incidence is...
asked 10 months ago -
A block of mass 0.249 kg is placed on top of a light, vertical
spring of...
asked 10 months ago -
how do the kidneys compensate in the presences of acidosis
a) trigger hyperventilate
b) reserve acid...
asked 10 months ago -
Question 501 pts
The rental rate of capital to the firm increases. Which of the
following...
asked 10 months ago