
Homework Answers
empirical rule graphs can be constructed as follows
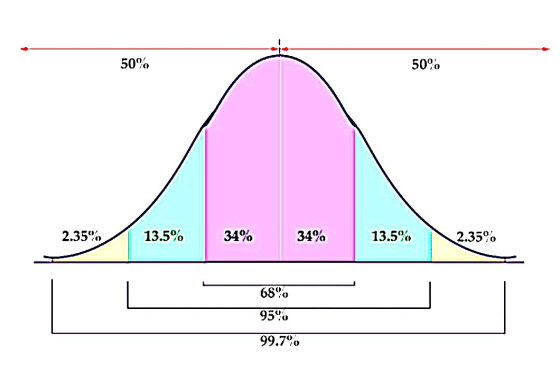
from above graph it is clear that above 2 standard deviation, on right side, information is 2.35 %
now above 79+2*6 = 91 it will be
2.35% X 281
6.6035
7 approx .
option sixth is correct.
please like ??
Add Answer to:
Scores of 281 students on an exam were normally distributed with the mean 79 and the...
Scores of 239 students on an exam were normally distributed with the mean 79 and the...
 Scores of 239 students on an exam were normally distributed with the mean 79 and the standard deviation of 6. Using the "68-95-99.7" rule, estimate how many students score above 91 9 Not enough information to answer the question 12 6 2 3 13 None of the given numerical values is correct
Question 14 2 pt Scores of 166 students on an exam were normally distributed with the...
 Question 14 2 pt Scores of 166 students on an exam were normally distributed with the mean 79 and the standard deviation of 6. Using the "68-95-99.7" rule, estimate how many students score above 91 O1 o O 8 O2 O 6 Not enough information to answ nswer the question None of the given numerical values is correct
A set of exam scores is normally distributed with a mean = 76 and standard deviation...
A set of exam scores is normally distributed with a mean = 76 and standard deviation = 7. Use the Empirical Rule to complete the following sentences. 68% of the scores are between and . 95% of the scores are between and . 99.7% of the scores are between and .
The time it takes students to complete an ES1-3215 final exam is normally distributed with a...
 The time it takes students to complete an ES1-3215 final exam is normally distributed with a mean of 74 min and a standard deviation of 21 min. How much time should be allowed to ensure that 90.0% of the students can complete the exam on time? (Round numerical value to the nearest minute) Not enough information to answer the question 95 min O 101 min 97 min 99 min 112 min O None of the given numerical values is correct...
The scores of students on an exam are normally distributed with a mean of 225 and...
The scores of students on an exam are normally distributed with a mean of 225 and a standard deviation of 38. (a) What is the lower quartile score for this exam? (Recall that the first quartile is the value in a data set with 25% of the observations being lower.)
The scores on a psychology exam were normally distributed with a mean of 58 and a...
The scores on a psychology exam were normally distributed with a mean of 58 and a standard deviation of 6. A failing grade on the exam was anything 2 or more standard deviation below the mean. What was the cutoff for a failing score? Approximately what percentage of the students failed? The cutoff for a failing score was ____ Simplify answer) Approximately ___ percent of the students failed ( Round to one decimal place as needed)
Assume that a set of test scores is normally distributed with a mean of 100 and...
Assume that a set of test scores is normally distributed with a mean of 100 and a standard deviation of 25. Use the 68-95-99.7 rule to find the following quantities.
The scores on a psychology exam were normally distributed with a mean of 57 and a...
The scores on a psychology exam were normally distributed with a mean of 57 and a standard deviation of 8. A failing grade on the exam was anything 2 or more standard deviations below the mean. What was the cutoff for a failing score? Approximately what percentage of the students failed? The cutoff for a failing score was______? (Simplify your answer)
The scores on a psychology exam were normally distributed with a mean of 62 and a...
 The scores on a psychology exam were normally distributed with a mean of 62 and a standard deviation of 9. A failing grade on the exam was anything 2 or more standard deviations below the mean. What was the cutoff for a failing score? Approximately what percentage of the students failed? The cutoff for a failing score was 44. (Simplify your answer.) Approximately percent of the students failed. (Round to one decimal place as needed.)
The final exam scores in a statistics class were normally distributed with a mean of 70...
The final exam scores in a statistics class were normally distributed with a mean of 70 and a standard deviation of 2. If you select a student at random, what is the probability that he scored between a 66 and a 74? A.2.5% B.50% C. 68% C. 95% D. none of the above
 Scores of 239 students on an exam were normally distributed with the mean 79 and the standard deviation of 6. Using the "68-95-99.7" rule, estimate how many students score above 91 9 Not enough information to answer the question 12 6 2 3 13 None of the given numerical values is correct
 Question 14 2 pt Scores of 166 students on an exam were normally distributed with the mean 79 and the standard deviation of 6. Using the "68-95-99.7" rule, estimate how many students score above 91 O1 o O 8 O2 O 6 Not enough information to answ nswer the question None of the given numerical values is correct
 The time it takes students to complete an ES1-3215 final exam is normally distributed with a mean of 74 min and a standard deviation of 21 min. How much time should be allowed to ensure that 90.0% of the students can complete the exam on time? (Round numerical value to the nearest minute) Not enough information to answer the question 95 min O 101 min 97 min 99 min 112 min O None of the given numerical values is correct...
 The scores on a psychology exam were normally distributed with a mean of 62 and a standard deviation of 9. A failing grade on the exam was anything 2 or more standard deviations below the mean. What was the cutoff for a failing score? Approximately what percentage of the students failed? The cutoff for a failing score was 44. (Simplify your answer.) Approximately percent of the students failed. (Round to one decimal place as needed.)
Most questions answered within 3 hours.
-
Where is the error in this code sequence?
String s1 = "Hello";
String s2 = "ello";...
asked 11 months ago -
Financial data for Joel de Paris, Inc., for last year
follow:
Joel de Paris, Inc.
Balance...
asked 11 months ago -
Consider this reaction:
Al2(SO4)3 (aq)+ BaCl3
(aq) Al2Cl6 (aq)- +
3BaSO4(s) . What is the...
asked 11 months ago -
Suppose that Savneet is considering increasing her
recent random sample from 20 car rentals to 40...
asked 11 months ago -
Trucks arrive at an unloading terminal at an average rate of 120
per hour.
Trucks arrive...
asked 11 months ago -
Why are methanol and ethanol completely soluble in water while
octanol is not very little soluble....
asked 11 months ago -
A facilities manager at a university reads in a research report
that the mean amount of...
asked 11 months ago -
When the CuSO4 is rehydrated by adding water to the anhydrous
compound, is this an endothermic...
asked 11 months ago -
A ray of sunlight is passing from diamond into crown glass; the
angle of incidence is...
asked 11 months ago -
A block of mass 0.249 kg is placed on top of a light, vertical
spring of...
asked 11 months ago -
how do the kidneys compensate in the presences of acidosis
a) trigger hyperventilate
b) reserve acid...
asked 11 months ago -
Question 501 pts
The rental rate of capital to the firm increases. Which of the
following...
asked 11 months ago