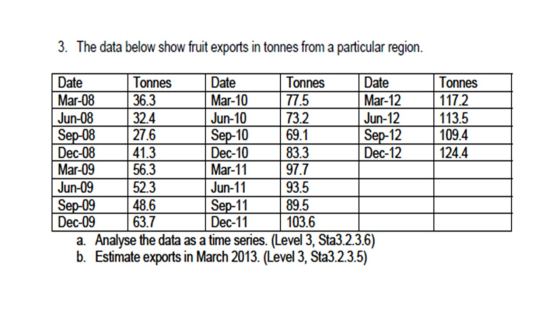
The data below show fruit exports in tonnes from a particular region.
a. Analyse the data as a time series. (Level 3,
Sta3.2.3.6)
b. Estimate exports in March 2013. (Level 3, Sta3.2.3.5)
Homework Answers
(a) The plot is:

(b)
| Period | Demand (y) | Period(x) |
| Period 1 | 36.3 | 1 |
| Period 2 | 32.4 | 2 |
| Period 3 | 27.6 | 3 |
| Period 4 | 41.3 | 4 |
| Period 5 | 56.3 | 5 |
| Period 6 | 52.3 | 6 |
| Period 7 | 48.6 | 7 |
| Period 8 | 63.7 | 8 |
| Period 9 | 77.5 | 9 |
| Period 10 | 73.2 | 10 |
| Period 11 | 69.1 | 11 |
| Period 12 | 83.3 | 12 |
| Period 13 | 97.7 | 13 |
| Period 14 | 93.5 | 14 |
| Period 15 | 89.5 | 15 |
| Period 16 | 103.6 | 16 |
| Period 17 | 117.2 | 17 |
| Period 18 | 113.5 | 18 |
| Period 19 | 109.4 | 19 |
| Period 20 | 124.4 | 20 |
| Intercept | 23.3294737 | |
| Slope | 4.97052632 | |
| Forecast | 127.710526 | 21 |
Add Answer to:
The data below show fruit exports in tonnes from a particular
region.
a. Analyse the data...
Date Gasoline Crude Oil Jan 01, 2010 2.031 79.07 Jan 08, 2010 2.124 82.34 Jan 15,...
 Date Gasoline Crude Oil
Jan 01, 2010 2.031 79.07
Jan 08, 2010 2.124 82.34
Jan 15, 2010 2.079 80.06
Jan 22, 2010 2.010 76.62
Jan 29, 2010 1.942 73.94
Feb 05, 2010 1.885 74.57
Feb 12, 2010 1.908 73.88
Feb 19, 2010 2.031 78.25
Feb 26, 2010 2.042 79.22
Mar 05, 2010 2.127 80.19
Mar 12, 2010 2.154 81.76
Mar 19, 2010 2.150 81.44
Mar 26, 2010 2.118 80.65
Apr 02, 2010 2.191 83.01
Apr 09, 2010 2.238 85.66
Apr...
Date Gasoline Crude Oil
Jan 01, 2010 2.031 79.07
Jan 08, 2010 2.124 82.34
Jan 15, 2010 2.079 80.06
Jan 22, 2010 2.010 76.62
Jan 29, 2010 1.942 73.94
Feb 05, 2010 1.885 74.57
Feb 12, 2010 1.908 73.88
Feb 19, 2010 2.031 78.25
Feb 26, 2010 2.042 79.22
Mar 05, 2010 2.127 80.19
Mar 12, 2010 2.154 81.76
Mar 19, 2010 2.150 81.44
Mar 26, 2010 2.118 80.65
Apr 02, 2010 2.191 83.01
Apr 09, 2010 2.238 85.66
Apr...
Code with Java using arrays and Scanner only ( input should end with 0 to terminate...
Code with Java using arrays and Scanner only ( input should end with 0 to terminate the program) Everyone loves to be celebrated on their birthdays. Birthday celebration can encourage positive social interaction among co-workers, foster friendship among classmates or even strengthen bond between families. Birthday graph can be display in many forms. It can a creative drawing consists of cupcakes, balloons, candles with names, or it can be in the form of simple bar chart to indicate the birthday...
insert a formula into cell E6 that subtracts the hire date in cell D6 from the...
 insert a formula into cell E6 that subtracts the hire date in
cell D6 from the date in cell D1, and divides that result by 365.
Set up the formulas so it can be copied by other cells in Column E
while continuing to reference the date in Cell D1 and divide by the
number 365. Make sure there are no blank spaces within the formula.
Remove all decimal places from the result.
please make sure to explain everything in...
insert a formula into cell E6 that subtracts the hire date in
cell D6 from the date in cell D1, and divides that result by 365.
Set up the formulas so it can be copied by other cells in Column E
while continuing to reference the date in Cell D1 and divide by the
number 365. Make sure there are no blank spaces within the formula.
Remove all decimal places from the result.
please make sure to explain everything in...
From the following monthly stock prices assume rf of 0.5% per month and calculate 1.Monthly growth...
 From the following monthly stock prices assume rf of 0.5% per
month and calculate
1.Monthly growth return
2.CAPM and beta
3.Average return
4.Variance
5.Covariance
6. Assume a credit rating and calculate a VAT assuming debt to
equity structure
1 date share price benchmark 2 Mar 18 3 Feb-18 4 Jan-18 5 Dec-17 6 Nov-17 7 Oct-17 8 Sep-17 304.85 24,263.35 322.3 25,107.40 354.4 27,379.45 315.15 25,539.45 306.9 25,332.40 314.25 25,019.35 350 24.053.00 350.61 24,318.40 361.9 25,103.65 292.7 23,211.20 286.27 23,424.80...
From the following monthly stock prices assume rf of 0.5% per
month and calculate
1.Monthly growth return
2.CAPM and beta
3.Average return
4.Variance
5.Covariance
6. Assume a credit rating and calculate a VAT assuming debt to
equity structure
1 date share price benchmark 2 Mar 18 3 Feb-18 4 Jan-18 5 Dec-17 6 Nov-17 7 Oct-17 8 Sep-17 304.85 24,263.35 322.3 25,107.40 354.4 27,379.45 315.15 25,539.45 306.9 25,332.40 314.25 25,019.35 350 24.053.00 350.61 24,318.40 361.9 25,103.65 292.7 23,211.20 286.27 23,424.80...
question asking for moving average .. i used the data analysis tool in excel it gives...
 question asking for moving average .. i used the data analysis
tool in excel it gives me the right answer but with wrong in
sequence
The normal Fourmal says = Sum of 3 months / 3 = F for
the 4th month
But in data analysis tool it comes in forecast of the
3rd month
please let me know why it does not come in the right sequence
and how to solve this issue
1 A-F^2 25.61 by using Normal...
question asking for moving average .. i used the data analysis
tool in excel it gives me the right answer but with wrong in
sequence
The normal Fourmal says = Sum of 3 months / 3 = F for
the 4th month
But in data analysis tool it comes in forecast of the
3rd month
please let me know why it does not come in the right sequence
and how to solve this issue
1 A-F^2 25.61 by using Normal...
2. Using the information from the screenshot below, what is the holding period return (daily return)...
 2. Using the information from the screenshot below, what is the holding period return (daily return) from RIF on Friday, September 13, 2019? Raymond James Financial, Inc. (RJF) NYSE. Nasdaq Real Time Price. Currency in USD Add to watchlist eg Visitors trend 2W10W 9M 1 86.65 -0.46 (-0.53%) Buy Sell As of 11:01AM EDT. Market open. Summary Company Outlook Chart Conversations Statistics Historical Data Profile Financial Analysis Options Time Period: Sep 16, 2018 - Sep 16, 2019 Show: Historical Prices...
Part C: Assorted short questions C1. Multiple choice while the short-run C.1.1 The long-run model determines...
 Part C: Assorted short questions C1. Multiple choice while the short-run C.1.1 The long-run model determines output and model determines and inflation, a. potential, long-run inflation, current output; current b. potential, unemployment; current output; long-run c. current; long-run inflation, unemployment; current d. potential; unemployment; unemployment; current e. current, unemployment; potential output; current | СРІ Quarter Sep-2016 Dec-2016 Mar-2017 Jun-2017 Sep-2017 Dec-2017 Mar-2018 Jun-2018 Sep-2018 Dec-2018 1 109.4 110.0 110.5 110.7 111.4 112.1 112.6 113.0 113.5 114.1 C.1.2 The table above...
Java code BIRTHDAY GRAPH5 4B Input Standard input Output Standard output Topic Array & Array Processing...
 Java code
BIRTHDAY GRAPH5 4B Input Standard input Output Standard output Topic Array & Array Processing Birthday Graph Problem Description Everyone loves to be celebrated on their birthdays. Birthday celebration can encourage positive social E interaction among co-workers, foster friendship among classmates or even strengthen bond between E BOBO Birthday graph can be display in many forms. It can a creative drawing consists of cupcakes, balloons, UU candles with names, or it can be in the form of simple bar...
Java code
BIRTHDAY GRAPH5 4B Input Standard input Output Standard output Topic Array & Array Processing Birthday Graph Problem Description Everyone loves to be celebrated on their birthdays. Birthday celebration can encourage positive social E interaction among co-workers, foster friendship among classmates or even strengthen bond between E BOBO Birthday graph can be display in many forms. It can a creative drawing consists of cupcakes, balloons, UU candles with names, or it can be in the form of simple bar...
On Blackboard under "Course Content / Homeworks and Practice Tests" there is an Excel file titled...
 On Blackboard under "Course Content / Homeworks and Practice Tests" there is an Excel file titled "HW 6 Data" with monthly stock return data to be used for this question: What is Deckers Outdoor Corporation's [DECK] beta? Round to two decimal places. [Hint: Take S&P 500 as a proxy for the market, and use the beta formula from the book. You will need to use two Excel functions: STDEV.S and CORREL] Numeric Answer S&PS00 DECK NKE SBUX -1.5% Ос-19 7.4%...
integrated mini-case: Disney’s Beta When you go on the web to find a firm’s beta, you...
 integrated mini-case: Disney’s Beta
When you go on the web to find a firm’s beta, you do not know
how recently it was computed, what index was used as a proxy for
the market portfolio, or which time series of returns the
calculations used. Earlier in this chapter, it was shown that when
we went on the Web to find a beta for Disney, we found the
following: MSN Money (1.29) and Yahoo! Finance (1.18). An
alternative is to compute...
integrated mini-case: Disney’s Beta
When you go on the web to find a firm’s beta, you do not know
how recently it was computed, what index was used as a proxy for
the market portfolio, or which time series of returns the
calculations used. Earlier in this chapter, it was shown that when
we went on the Web to find a beta for Disney, we found the
following: MSN Money (1.29) and Yahoo! Finance (1.18). An
alternative is to compute...
 Date Gasoline Crude Oil
Jan 01, 2010 2.031 79.07
Jan 08, 2010 2.124 82.34
Jan 15, 2010 2.079 80.06
Jan 22, 2010 2.010 76.62
Jan 29, 2010 1.942 73.94
Feb 05, 2010 1.885 74.57
Feb 12, 2010 1.908 73.88
Feb 19, 2010 2.031 78.25
Feb 26, 2010 2.042 79.22
Mar 05, 2010 2.127 80.19
Mar 12, 2010 2.154 81.76
Mar 19, 2010 2.150 81.44
Mar 26, 2010 2.118 80.65
Apr 02, 2010 2.191 83.01
Apr 09, 2010 2.238 85.66
Apr...
Date Gasoline Crude Oil
Jan 01, 2010 2.031 79.07
Jan 08, 2010 2.124 82.34
Jan 15, 2010 2.079 80.06
Jan 22, 2010 2.010 76.62
Jan 29, 2010 1.942 73.94
Feb 05, 2010 1.885 74.57
Feb 12, 2010 1.908 73.88
Feb 19, 2010 2.031 78.25
Feb 26, 2010 2.042 79.22
Mar 05, 2010 2.127 80.19
Mar 12, 2010 2.154 81.76
Mar 19, 2010 2.150 81.44
Mar 26, 2010 2.118 80.65
Apr 02, 2010 2.191 83.01
Apr 09, 2010 2.238 85.66
Apr...
 insert a formula into cell E6 that subtracts the hire date in
cell D6 from the date in cell D1, and divides that result by 365.
Set up the formulas so it can be copied by other cells in Column E
while continuing to reference the date in Cell D1 and divide by the
number 365. Make sure there are no blank spaces within the formula.
Remove all decimal places from the result.
please make sure to explain everything in...
insert a formula into cell E6 that subtracts the hire date in
cell D6 from the date in cell D1, and divides that result by 365.
Set up the formulas so it can be copied by other cells in Column E
while continuing to reference the date in Cell D1 and divide by the
number 365. Make sure there are no blank spaces within the formula.
Remove all decimal places from the result.
please make sure to explain everything in...
 From the following monthly stock prices assume rf of 0.5% per
month and calculate
1.Monthly growth return
2.CAPM and beta
3.Average return
4.Variance
5.Covariance
6. Assume a credit rating and calculate a VAT assuming debt to
equity structure
1 date share price benchmark 2 Mar 18 3 Feb-18 4 Jan-18 5 Dec-17 6 Nov-17 7 Oct-17 8 Sep-17 304.85 24,263.35 322.3 25,107.40 354.4 27,379.45 315.15 25,539.45 306.9 25,332.40 314.25 25,019.35 350 24.053.00 350.61 24,318.40 361.9 25,103.65 292.7 23,211.20 286.27 23,424.80...
From the following monthly stock prices assume rf of 0.5% per
month and calculate
1.Monthly growth return
2.CAPM and beta
3.Average return
4.Variance
5.Covariance
6. Assume a credit rating and calculate a VAT assuming debt to
equity structure
1 date share price benchmark 2 Mar 18 3 Feb-18 4 Jan-18 5 Dec-17 6 Nov-17 7 Oct-17 8 Sep-17 304.85 24,263.35 322.3 25,107.40 354.4 27,379.45 315.15 25,539.45 306.9 25,332.40 314.25 25,019.35 350 24.053.00 350.61 24,318.40 361.9 25,103.65 292.7 23,211.20 286.27 23,424.80...
 question asking for moving average .. i used the data analysis
tool in excel it gives me the right answer but with wrong in
sequence
The normal Fourmal says = Sum of 3 months / 3 = F for
the 4th month
But in data analysis tool it comes in forecast of the
3rd month
please let me know why it does not come in the right sequence
and how to solve this issue
1 A-F^2 25.61 by using Normal...
question asking for moving average .. i used the data analysis
tool in excel it gives me the right answer but with wrong in
sequence
The normal Fourmal says = Sum of 3 months / 3 = F for
the 4th month
But in data analysis tool it comes in forecast of the
3rd month
please let me know why it does not come in the right sequence
and how to solve this issue
1 A-F^2 25.61 by using Normal...
 2. Using the information from the screenshot below, what is the holding period return (daily return) from RIF on Friday, September 13, 2019? Raymond James Financial, Inc. (RJF) NYSE. Nasdaq Real Time Price. Currency in USD Add to watchlist eg Visitors trend 2W10W 9M 1 86.65 -0.46 (-0.53%) Buy Sell As of 11:01AM EDT. Market open. Summary Company Outlook Chart Conversations Statistics Historical Data Profile Financial Analysis Options Time Period: Sep 16, 2018 - Sep 16, 2019 Show: Historical Prices...
 Part C: Assorted short questions C1. Multiple choice while the short-run C.1.1 The long-run model determines output and model determines and inflation, a. potential, long-run inflation, current output; current b. potential, unemployment; current output; long-run c. current; long-run inflation, unemployment; current d. potential; unemployment; unemployment; current e. current, unemployment; potential output; current | СРІ Quarter Sep-2016 Dec-2016 Mar-2017 Jun-2017 Sep-2017 Dec-2017 Mar-2018 Jun-2018 Sep-2018 Dec-2018 1 109.4 110.0 110.5 110.7 111.4 112.1 112.6 113.0 113.5 114.1 C.1.2 The table above...
 Java code
BIRTHDAY GRAPH5 4B Input Standard input Output Standard output Topic Array & Array Processing Birthday Graph Problem Description Everyone loves to be celebrated on their birthdays. Birthday celebration can encourage positive social E interaction among co-workers, foster friendship among classmates or even strengthen bond between E BOBO Birthday graph can be display in many forms. It can a creative drawing consists of cupcakes, balloons, UU candles with names, or it can be in the form of simple bar...
Java code
BIRTHDAY GRAPH5 4B Input Standard input Output Standard output Topic Array & Array Processing Birthday Graph Problem Description Everyone loves to be celebrated on their birthdays. Birthday celebration can encourage positive social E interaction among co-workers, foster friendship among classmates or even strengthen bond between E BOBO Birthday graph can be display in many forms. It can a creative drawing consists of cupcakes, balloons, UU candles with names, or it can be in the form of simple bar...
 On Blackboard under "Course Content / Homeworks and Practice Tests" there is an Excel file titled "HW 6 Data" with monthly stock return data to be used for this question: What is Deckers Outdoor Corporation's [DECK] beta? Round to two decimal places. [Hint: Take S&P 500 as a proxy for the market, and use the beta formula from the book. You will need to use two Excel functions: STDEV.S and CORREL] Numeric Answer S&PS00 DECK NKE SBUX -1.5% Ос-19 7.4%...
 integrated mini-case: Disney’s Beta
When you go on the web to find a firm’s beta, you do not know
how recently it was computed, what index was used as a proxy for
the market portfolio, or which time series of returns the
calculations used. Earlier in this chapter, it was shown that when
we went on the Web to find a beta for Disney, we found the
following: MSN Money (1.29) and Yahoo! Finance (1.18). An
alternative is to compute...
integrated mini-case: Disney’s Beta
When you go on the web to find a firm’s beta, you do not know
how recently it was computed, what index was used as a proxy for
the market portfolio, or which time series of returns the
calculations used. Earlier in this chapter, it was shown that when
we went on the Web to find a beta for Disney, we found the
following: MSN Money (1.29) and Yahoo! Finance (1.18). An
alternative is to compute...
Most questions answered within 3 hours.
-
Where is the error in this code sequence?
String s1 = "Hello";
String s2 = "ello";...
asked 10 months ago -
Financial data for Joel de Paris, Inc., for last year
follow:
Joel de Paris, Inc.
Balance...
asked 10 months ago -
Consider this reaction:
Al2(SO4)3 (aq)+ BaCl3
(aq) Al2Cl6 (aq)- +
3BaSO4(s) . What is the...
asked 10 months ago -
Suppose that Savneet is considering increasing her
recent random sample from 20 car rentals to 40...
asked 10 months ago -
Trucks arrive at an unloading terminal at an average rate of 120
per hour.
Trucks arrive...
asked 10 months ago -
Why are methanol and ethanol completely soluble in water while
octanol is not very little soluble....
asked 10 months ago -
A facilities manager at a university reads in a research report
that the mean amount of...
asked 10 months ago -
When the CuSO4 is rehydrated by adding water to the anhydrous
compound, is this an endothermic...
asked 10 months ago -
A ray of sunlight is passing from diamond into crown glass; the
angle of incidence is...
asked 10 months ago -
A block of mass 0.249 kg is placed on top of a light, vertical
spring of...
asked 10 months ago -
how do the kidneys compensate in the presences of acidosis
a) trigger hyperventilate
b) reserve acid...
asked 10 months ago -
Question 501 pts
The rental rate of capital to the firm increases. Which of the
following...
asked 10 months ago