. ONE-WAY ANOVA. Is age related to who they voted for in the 1992 Presidential Election...
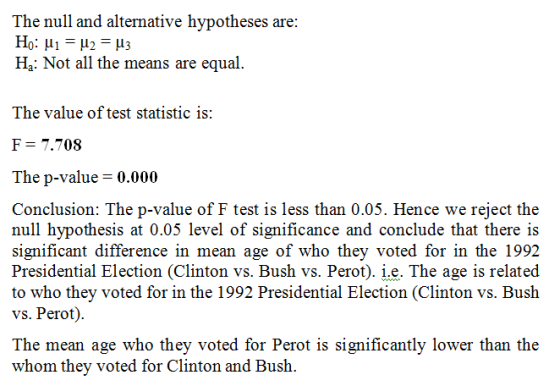
. ONE-WAY ANOVA. Is age related to who they voted for in the 1992 Presidential Election (Clinton vs. Bush vs. Perot)? If so, specify how they relate?
|
Descriptives |
||||||||
|
Age of Respondent |
||||||||
|
N |
Mean |
Std. Deviation |
Std. Error |
95% Confidence Interval for Mean |
Minimum |
Maximum |
||
|
Lower Bound |
Upper Bound |
|||||||
|
CLINTON |
431 |
48.33 |
16.802 |
.809 |
46.74 |
49.92 |
19 |
89 |
|
BUSH |
384 |
49.09 |
17.571 |
.897 |
47.33 |
50.85 |
19 |
89 |
|
PEROT |
187 |
43.42 |
15.020 |
1.098 |
41.25 |
45.58 |
19 |
89 |
|
Total |
1002 |
47.71 |
16.901 |
.534 |
46.66 |
48.75 |
19 |
89 |
|
ANOVA |
|||||
|
Age of Respondent |
|||||
|
Sum of Squares |
df |
Mean Square |
F |
Sig. |
|
|
Between Groups |
4345.319 |
2 |
2172.660 |
7.708 |
.000 |
|
Within Groups |
281590.830 |
999 |
281.873 |
||
|
Total |
285936.149 |
1001 |
|||
|
Multiple Comparisons |
||||||
|
Dependent Variable: Age of Respondent |
||||||
|
Tukey HSD |
||||||
|
(I) VOTE FOR CLINTON, BUSH, PEROT |
(J) VOTE FOR CLINTON, BUSH, PEROT |
Mean Difference (I-J) |
Std. Error |
Sig. |
95% Confidence Interval |
|
|
Lower Bound |
Upper Bound |
|||||
|
CLINTON |
BUSH |
-.759 |
1.178 |
.796 |
-3.52 |
2.01 |
|
PEROT |
4.915* |
1.470 |
.002 |
1.46 |
8.37 |
|
|
BUSH |
CLINTON |
.759 |
1.178 |
.796 |
-2.01 |
3.52 |
|
PEROT |
5.674* |
1.497 |
.000 |
2.16 |
9.19 |
|
|
PEROT |
CLINTON |
-4.915* |
1.470 |
.002 |
-8.37 |
-1.46 |
|
BUSH |
-5.674* |
1.497 |
.000 |
-9.19 |
-2.16 |
|
|
*. The mean difference is significant at the 0.05 level. |
||||||
Homework Answers
Add Answer to:
. ONE-WAY ANOVA. Is age related to who they voted for in the
1992 Presidential Election...
Most questions answered within 3 hours.
-
Where is the error in this code sequence?
String s1 = "Hello";
String s2 = "ello";...
asked 11 months ago -
Financial data for Joel de Paris, Inc., for last year
follow:
Joel de Paris, Inc.
Balance...
asked 11 months ago -
Consider this reaction:
Al2(SO4)3 (aq)+ BaCl3
(aq) Al2Cl6 (aq)- +
3BaSO4(s) . What is the...
asked 11 months ago -
Suppose that Savneet is considering increasing her
recent random sample from 20 car rentals to 40...
asked 11 months ago -
Trucks arrive at an unloading terminal at an average rate of 120
per hour.
Trucks arrive...
asked 11 months ago -
Why are methanol and ethanol completely soluble in water while
octanol is not very little soluble....
asked 11 months ago -
A facilities manager at a university reads in a research report
that the mean amount of...
asked 11 months ago -
When the CuSO4 is rehydrated by adding water to the anhydrous
compound, is this an endothermic...
asked 11 months ago -
A ray of sunlight is passing from diamond into crown glass; the
angle of incidence is...
asked 11 months ago -
A block of mass 0.249 kg is placed on top of a light, vertical
spring of...
asked 11 months ago -
how do the kidneys compensate in the presences of acidosis
a) trigger hyperventilate
b) reserve acid...
asked 11 months ago -
Question 501 pts
The rental rate of capital to the firm increases. Which of the
following...
asked 11 months ago