
Homework Answers
Part(a)
.
equation of the line is


put all data points


system Ax=b is

here we have
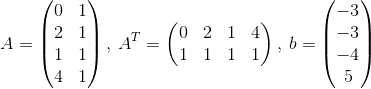
.
take 


.
take 


.
now solve the system for
![LATA].x = AT6](http://img.homeworklib.com/questions/373aff90-e34b-11ea-b7bf-1f10fb8a1997.png?x-oss-process=image/resize,w_560)

the augmented matrix is


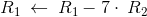


least-square solution is

so best fit line

.
.
Part(a)
.

from the graph, we can see that it is not the best fit line
the best fit curve would be a parabola
Add Answer to:
please answer all parts
4. Least Square Method A. (10 points) Use the least squares method...
Least Square Method Use the least squares method and find a linear fit for the following...
 Least Square Method Use the least squares method and find a linear fit for the following points: (0, -3), (2, -3), (1, -4), (4, 5) Quickly plot the points (by hand) and comment on the likely quality of the linear fit. Would another type of curve fit be better suited?
Least Square Method Use the least squares method and find a linear fit for the following...
 Least Square Method Use the least squares method and find a linear fit for the following points: (0, -3), (2, -3), (1, -4), (4, 5)
Use matlab or python please! 3. Estimate the order of accuracy by doing a least squares...
 Use matlab or python please!
3. Estimate the order of accuracy by doing a least squares fit of the form log(E(H))- Kplog(H) to determine K and p based on the 500 data points. Recall that this can be done by solving the following linear system in the least squares sense: 1 log(Hi) 1 log(H2) 1 Гкі log(E(Hi)) | log(E(H2)) 1 log(Hsoo log(E(H,00 NOTE: "In the least-squares sense means that one should solve the rectangular system Ax = b, by solving...
Use matlab or python please!
3. Estimate the order of accuracy by doing a least squares fit of the form log(E(H))- Kplog(H) to determine K and p based on the 500 data points. Recall that this can be done by solving the following linear system in the least squares sense: 1 log(Hi) 1 log(H2) 1 Гкі log(E(Hi)) | log(E(H2)) 1 log(Hsoo log(E(H,00 NOTE: "In the least-squares sense means that one should solve the rectangular system Ax = b, by solving...
Please explain your answer Suppose that we use least-squares to fit a polynomial trend to this...
 Please explain your answer
Suppose that we use least-squares to fit a polynomial trend to this time series. Figure 4 displays the original time series plot along with the fitted values. Time Series and Polynomial Fit of the Trend 10 15 Time Figure 4 Which of the following characteristics is the model able to capture? Trend Seasonality Trend and seasonality Seasonality and heteroskedasticity
Please explain your answer
Suppose that we use least-squares to fit a polynomial trend to this time series. Figure 4 displays the original time series plot along with the fitted values. Time Series and Polynomial Fit of the Trend 10 15 Time Figure 4 Which of the following characteristics is the model able to capture? Trend Seasonality Trend and seasonality Seasonality and heteroskedasticity
Please explain your answer Suppose that we use least-squares to fit a seasonal-means trend to this...
 Please explain your answer
Suppose that we use least-squares to fit a seasonal-means trend to this time series. Figure 3 displays the original time series plot along wtih the fitted values. Time Series and Seasonal-Means Fit 10 15 Time Figure 3 Which of the following characteristics is the model able to capture? Trend Seasonality ● Trend and seasonality Seasonality and heteroskedasticity
Please explain your answer
Suppose that we use least-squares to fit a seasonal-means trend to this time series. Figure 3 displays the original time series plot along wtih the fitted values. Time Series and Seasonal-Means Fit 10 15 Time Figure 3 Which of the following characteristics is the model able to capture? Trend Seasonality ● Trend and seasonality Seasonality and heteroskedasticity
Please answer these two sub-parts please answer only 10. Chi Square one. Give Handwritten. Ignore all...
 Please answer these two sub-parts
please answer only 10. Chi Square one. Give Handwritten. Ignore all
the above questions
Question 4 (20 points) A firm has the following short-run production function as follows: Q = 15L + 18L2 – 0.5L}, where Q = total products per period and L = number of workers employed per period. 4.3) (6 points) Determine the boundaries (ranges of number of workers) for the three stages of production process . Stage 1: Stage II: •...
Please answer these two sub-parts
please answer only 10. Chi Square one. Give Handwritten. Ignore all
the above questions
Question 4 (20 points) A firm has the following short-run production function as follows: Q = 15L + 18L2 – 0.5L}, where Q = total products per period and L = number of workers employed per period. 4.3) (6 points) Determine the boundaries (ranges of number of workers) for the three stages of production process . Stage 1: Stage II: •...
Fit a linear function of the form f (t) = c0 +c1t to the data points (-4;22), (0;-3), (4;-34), using least squares. c...
Fit a linear function of the form f (t) = c0 +c1t to the data points (-4;22), (0;-3), (4;-34), using least squares. c0 =? c1=?
please write down detailed solution (do not copy 3. [Polynomial interpolation versus least squares fitting, 10pts]...
 please write down detailed solution (do not copy
3. [Polynomial interpolation versus least squares fitting, 10pts] Recall how Q7 in HW3 required you to find the cubic best fit to six given data points. This led to a least squares optimization problem. We are given the same points as in HW3: i 01 | 2 | 3 | 4 | 5 X 0.0 0.5 1.0 1.5 2.0 2.5 Y 0.0 0.20 0.27 0.30 0.32 0.33 (a) Write down the least...
please write down detailed solution (do not copy
3. [Polynomial interpolation versus least squares fitting, 10pts] Recall how Q7 in HW3 required you to find the cubic best fit to six given data points. This led to a least squares optimization problem. We are given the same points as in HW3: i 01 | 2 | 3 | 4 | 5 X 0.0 0.5 1.0 1.5 2.0 2.5 Y 0.0 0.20 0.27 0.30 0.32 0.33 (a) Write down the least...
Please show work Method of Least Squares, Developing and Using the Cost Formula The method of...
 Please show work
Method of Least Squares, Developing and Using the Cost Formula The method of least squares was used to develop a cost equation to predict the cost of receiving purchased parts at a video game manufacturer. Ninety-six data points from monthly data were used for the regression. The following computer output was received: Intercept 183,800 Slope 295 The cost driver used was number of parts inspected. Required: 1. What is the cost formula? Total cost of receiving =...
Please show work
Method of Least Squares, Developing and Using the Cost Formula The method of least squares was used to develop a cost equation to predict the cost of receiving purchased parts at a video game manufacturer. Ninety-six data points from monthly data were used for the regression. The following computer output was received: Intercept 183,800 Slope 295 The cost driver used was number of parts inspected. Required: 1. What is the cost formula? Total cost of receiving =...
0 3 X Y 2 4 4 Given to the right are two linear equations and...
 0 3 X Y 2 4 4 Given to the right are two linear equations and a set of data points a. Graph the linear equations and data points. b. Complete tables for X. y. y. e, and e? c. Determine which line fits the set of data points better, according to the least squares criterion Line Ay=-1+3x Line : y=1+2x a. Graph the linear equations and data points. Note that Line Ais dashed red and Line B is solid...
 Least Square Method Use the least squares method and find a linear fit for the following points: (0, -3), (2, -3), (1, -4), (4, 5) Quickly plot the points (by hand) and comment on the likely quality of the linear fit. Would another type of curve fit be better suited?
 Least Square Method Use the least squares method and find a linear fit for the following points: (0, -3), (2, -3), (1, -4), (4, 5)
 Use matlab or python please!
3. Estimate the order of accuracy by doing a least squares fit of the form log(E(H))- Kplog(H) to determine K and p based on the 500 data points. Recall that this can be done by solving the following linear system in the least squares sense: 1 log(Hi) 1 log(H2) 1 Гкі log(E(Hi)) | log(E(H2)) 1 log(Hsoo log(E(H,00 NOTE: "In the least-squares sense means that one should solve the rectangular system Ax = b, by solving...
Use matlab or python please!
3. Estimate the order of accuracy by doing a least squares fit of the form log(E(H))- Kplog(H) to determine K and p based on the 500 data points. Recall that this can be done by solving the following linear system in the least squares sense: 1 log(Hi) 1 log(H2) 1 Гкі log(E(Hi)) | log(E(H2)) 1 log(Hsoo log(E(H,00 NOTE: "In the least-squares sense means that one should solve the rectangular system Ax = b, by solving...
 Please explain your answer
Suppose that we use least-squares to fit a polynomial trend to this time series. Figure 4 displays the original time series plot along with the fitted values. Time Series and Polynomial Fit of the Trend 10 15 Time Figure 4 Which of the following characteristics is the model able to capture? Trend Seasonality Trend and seasonality Seasonality and heteroskedasticity
Please explain your answer
Suppose that we use least-squares to fit a polynomial trend to this time series. Figure 4 displays the original time series plot along with the fitted values. Time Series and Polynomial Fit of the Trend 10 15 Time Figure 4 Which of the following characteristics is the model able to capture? Trend Seasonality Trend and seasonality Seasonality and heteroskedasticity
 Please explain your answer
Suppose that we use least-squares to fit a seasonal-means trend to this time series. Figure 3 displays the original time series plot along wtih the fitted values. Time Series and Seasonal-Means Fit 10 15 Time Figure 3 Which of the following characteristics is the model able to capture? Trend Seasonality ● Trend and seasonality Seasonality and heteroskedasticity
Please explain your answer
Suppose that we use least-squares to fit a seasonal-means trend to this time series. Figure 3 displays the original time series plot along wtih the fitted values. Time Series and Seasonal-Means Fit 10 15 Time Figure 3 Which of the following characteristics is the model able to capture? Trend Seasonality ● Trend and seasonality Seasonality and heteroskedasticity
 Please answer these two sub-parts
please answer only 10. Chi Square one. Give Handwritten. Ignore all
the above questions
Question 4 (20 points) A firm has the following short-run production function as follows: Q = 15L + 18L2 – 0.5L}, where Q = total products per period and L = number of workers employed per period. 4.3) (6 points) Determine the boundaries (ranges of number of workers) for the three stages of production process . Stage 1: Stage II: •...
Please answer these two sub-parts
please answer only 10. Chi Square one. Give Handwritten. Ignore all
the above questions
Question 4 (20 points) A firm has the following short-run production function as follows: Q = 15L + 18L2 – 0.5L}, where Q = total products per period and L = number of workers employed per period. 4.3) (6 points) Determine the boundaries (ranges of number of workers) for the three stages of production process . Stage 1: Stage II: •...
 please write down detailed solution (do not copy
3. [Polynomial interpolation versus least squares fitting, 10pts] Recall how Q7 in HW3 required you to find the cubic best fit to six given data points. This led to a least squares optimization problem. We are given the same points as in HW3: i 01 | 2 | 3 | 4 | 5 X 0.0 0.5 1.0 1.5 2.0 2.5 Y 0.0 0.20 0.27 0.30 0.32 0.33 (a) Write down the least...
please write down detailed solution (do not copy
3. [Polynomial interpolation versus least squares fitting, 10pts] Recall how Q7 in HW3 required you to find the cubic best fit to six given data points. This led to a least squares optimization problem. We are given the same points as in HW3: i 01 | 2 | 3 | 4 | 5 X 0.0 0.5 1.0 1.5 2.0 2.5 Y 0.0 0.20 0.27 0.30 0.32 0.33 (a) Write down the least...
 Please show work
Method of Least Squares, Developing and Using the Cost Formula The method of least squares was used to develop a cost equation to predict the cost of receiving purchased parts at a video game manufacturer. Ninety-six data points from monthly data were used for the regression. The following computer output was received: Intercept 183,800 Slope 295 The cost driver used was number of parts inspected. Required: 1. What is the cost formula? Total cost of receiving =...
Please show work
Method of Least Squares, Developing and Using the Cost Formula The method of least squares was used to develop a cost equation to predict the cost of receiving purchased parts at a video game manufacturer. Ninety-six data points from monthly data were used for the regression. The following computer output was received: Intercept 183,800 Slope 295 The cost driver used was number of parts inspected. Required: 1. What is the cost formula? Total cost of receiving =...
 0 3 X Y 2 4 4 Given to the right are two linear equations and a set of data points a. Graph the linear equations and data points. b. Complete tables for X. y. y. e, and e? c. Determine which line fits the set of data points better, according to the least squares criterion Line Ay=-1+3x Line : y=1+2x a. Graph the linear equations and data points. Note that Line Ais dashed red and Line B is solid...
Most questions answered within 3 hours.
-
Where is the error in this code sequence?
String s1 = "Hello";
String s2 = "ello";...
asked 11 months ago -
Financial data for Joel de Paris, Inc., for last year
follow:
Joel de Paris, Inc.
Balance...
asked 11 months ago -
Consider this reaction:
Al2(SO4)3 (aq)+ BaCl3
(aq) Al2Cl6 (aq)- +
3BaSO4(s) . What is the...
asked 11 months ago -
Suppose that Savneet is considering increasing her
recent random sample from 20 car rentals to 40...
asked 11 months ago -
Trucks arrive at an unloading terminal at an average rate of 120
per hour.
Trucks arrive...
asked 11 months ago -
Why are methanol and ethanol completely soluble in water while
octanol is not very little soluble....
asked 11 months ago -
A facilities manager at a university reads in a research report
that the mean amount of...
asked 11 months ago -
When the CuSO4 is rehydrated by adding water to the anhydrous
compound, is this an endothermic...
asked 11 months ago -
A ray of sunlight is passing from diamond into crown glass; the
angle of incidence is...
asked 11 months ago -
A block of mass 0.249 kg is placed on top of a light, vertical
spring of...
asked 11 months ago -
how do the kidneys compensate in the presences of acidosis
a) trigger hyperventilate
b) reserve acid...
asked 11 months ago -
Question 501 pts
The rental rate of capital to the firm increases. Which of the
following...
asked 11 months ago