In a certain city, it is known that 10.05% of the residents have red hair. Suppose...
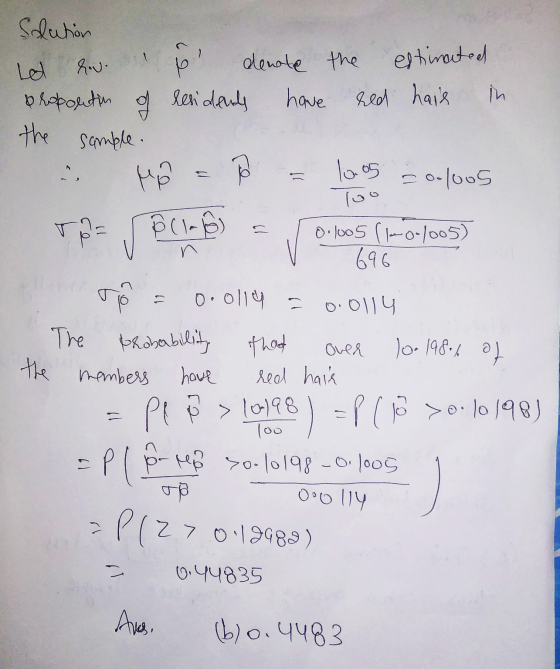
In a certain city, it is known that 10.05% of the residents have red hair. Suppose we select a random sample of 696 members. What is the probability that over 10.198% of the members in this sample have red hair?
Select one:
a. 0.5517
b. 0.4483
c. 0.0000
d. 0.1300
e. We cannot answer this question with the information given.
Homework Answers
The solution to this problem is given by
Add Answer to:
In a certain city, it is known that 10.05% of the residents have
red hair. Suppose...
In a certain city, it is known that 16.98% of the residents have red hair Suppose...
 In a certain city, it is known that 16.98% of the residents have red hair Suppose we select a random sample of 716 members. What is the probability that ever 15 829% of the members in this sample have red hair? Select one a. 0.7939 b. 0.2061 c08200 Od 0.0000 We cannot answer this question with the information given
In a certain city, it is known that 18.85% of the residents have red hair. Suppose...
In a certain city, it is known that 18.85% of the residents have red hair. Suppose we select a random sample of 772 members. What is the probability that over 18.09% of the members in this sample have red hair?
Life expectancy in a country is known to follow a left-skewed distribution with a mean value...
 Life expectancy in a country is known to follow a left-skewed distribution with a mean value of 81.00 years and a standard deviation of 3 30 years. Suppose we take a random sample of 15 members of this country, and calculate their average life expectancy. What is the probably that this sample has an average value of at most 80.97 years? Select one: O 0.3073 b. 0.5517 O c 0.1300 d. 0.4483 e. We cannot answer this question with the...
Question number 7: Consider the following variables. For each variable, identify its distribution as either "Exactly...
Question number 7: Consider the following variables. For each variable, identify its distribution as either "Exactly Normal," "Approximately Normal," or "Neither" (short for neither Exactly Normal nor Approximately Normal). Life expectancy in a country is known to follow a left-skewed distribution. Suppose we take a random sample of 7 citizens and denote the sample mean life expectancy by X̄. The distribution of X̄ is Choose... . The weights of bananas follow a Normal distribution. Suppose we take a sample of...
Consider the following variables. For each variable, identify its distribution as either "Exactly Normal," "Approximately Normal,"...
 Consider the following variables. For each variable, identify its distribution as either "Exactly Normal," "Approximately Normal," or "Neither" (short for neither Exactly Normal nor Approximately Normal). • Life expectancy in a country is known to follow a left-skewed distribution Suppose we take a random sample of 7 citizens and denote the sample mean life expectancy by X. The distribution of X is Choose... . The weights of bananas follow a Normal distribution Suppose we take a sample of 8 bananas,...
Chest circumferences of adult males are known to follow a Normal distribution with mean 40 inches...
Chest circumferences of adult males are known to follow a Normal distribution with mean 40 inches and standard deviation 2.1 inches. Suppose we collect a random sample of 66 adult males. What is the probability that the average chest circumference of this group will be exactly 39.97 inches? Select one: a. We cannot answer this question with the information given. b. 0.9400 c. 0.8264 d. 0.1736 e. 0.0000
Chest circumferences of adult males are known to follow a Normal distribution with mean 40 inches...
 Chest circumferences of adult males are known to follow a Normal distribution with mean 40 inches and standard deviation 21 inches Suppose we collect a random sample of 78 adult males. What is the probability that the average chest circumference of this group will be exactly 40.03 inches? Select one: O a We cannot answer this question with the information given. O b. 0.8365 c. 0.0000 d. 0.9800 e. O 1635
Lifetimes of a certain brand of lightbulbs is known to follow a right-skewed distribution with mean...
Lifetimes of a certain brand of lightbulbs is known to follow a right-skewed distribution with mean 24 months and standard deviation 2 months. Suppose that a sample of 14 lightbulbs is taken. What is the probability that the average lifetime of these bulbs is less than 23.5 months? Select one: a. Not enough information has been given to answer the question. b. 0.1736 c. 0.0000 d. 0.0000 e. 0.8264 f. 0.3472
Lifetimes of a certain brand of lightbulbs is known to follow a right-skewed distribution with mean...
Lifetimes of a certain brand of lightbulbs is known to follow a right-skewed distribution with mean 24 months and standard deviation 2 months. Suppose that a sample of 41 lightbulbs is taken. What is the probability that the total lifetime of these bulbs is less than 975 months? Select one: a. 0.7580 b. Not enough information has been given to answer the question. c. 0.0000 d. 0.5160 e. 0.2420 f. 0.4840 Select one: a. 0.7580 b. Not enough information has...
The percentage of coronavirus (COVID-19) infected people in a certain city is 15%. Suppose that we...
The percentage of coronavirus (COVID-19) infected people in a certain city is 15%. Suppose that we randomly select a sample of 6 people from this city. a) Find the probability that there will be one infected person in the sample. b) Find the expected number of infected people in the sample (E(X) = ?). c) Find the variance of the number of infected people in the sample (? 2 )
 In a certain city, it is known that 16.98% of the residents have red hair Suppose we select a random sample of 716 members. What is the probability that ever 15 829% of the members in this sample have red hair? Select one a. 0.7939 b. 0.2061 c08200 Od 0.0000 We cannot answer this question with the information given
 Life expectancy in a country is known to follow a left-skewed distribution with a mean value of 81.00 years and a standard deviation of 3 30 years. Suppose we take a random sample of 15 members of this country, and calculate their average life expectancy. What is the probably that this sample has an average value of at most 80.97 years? Select one: O 0.3073 b. 0.5517 O c 0.1300 d. 0.4483 e. We cannot answer this question with the...
 Consider the following variables. For each variable, identify its distribution as either "Exactly Normal," "Approximately Normal," or "Neither" (short for neither Exactly Normal nor Approximately Normal). • Life expectancy in a country is known to follow a left-skewed distribution Suppose we take a random sample of 7 citizens and denote the sample mean life expectancy by X. The distribution of X is Choose... . The weights of bananas follow a Normal distribution Suppose we take a sample of 8 bananas,...
 Chest circumferences of adult males are known to follow a Normal distribution with mean 40 inches and standard deviation 21 inches Suppose we collect a random sample of 78 adult males. What is the probability that the average chest circumference of this group will be exactly 40.03 inches? Select one: O a We cannot answer this question with the information given. O b. 0.8365 c. 0.0000 d. 0.9800 e. O 1635
Most questions answered within 3 hours.
-
Where is the error in this code sequence?
String s1 = "Hello";
String s2 = "ello";...
asked 11 months ago -
Financial data for Joel de Paris, Inc., for last year
follow:
Joel de Paris, Inc.
Balance...
asked 11 months ago -
Consider this reaction:
Al2(SO4)3 (aq)+ BaCl3
(aq) Al2Cl6 (aq)- +
3BaSO4(s) . What is the...
asked 11 months ago -
Suppose that Savneet is considering increasing her
recent random sample from 20 car rentals to 40...
asked 11 months ago -
Trucks arrive at an unloading terminal at an average rate of 120
per hour.
Trucks arrive...
asked 11 months ago -
Why are methanol and ethanol completely soluble in water while
octanol is not very little soluble....
asked 11 months ago -
A facilities manager at a university reads in a research report
that the mean amount of...
asked 11 months ago -
When the CuSO4 is rehydrated by adding water to the anhydrous
compound, is this an endothermic...
asked 11 months ago -
A ray of sunlight is passing from diamond into crown glass; the
angle of incidence is...
asked 11 months ago -
A block of mass 0.249 kg is placed on top of a light, vertical
spring of...
asked 11 months ago -
how do the kidneys compensate in the presences of acidosis
a) trigger hyperventilate
b) reserve acid...
asked 11 months ago -
Question 501 pts
The rental rate of capital to the firm increases. Which of the
following...
asked 11 months ago