Suppose that we randomly select 50 billing statements from each of the computer databases of the...
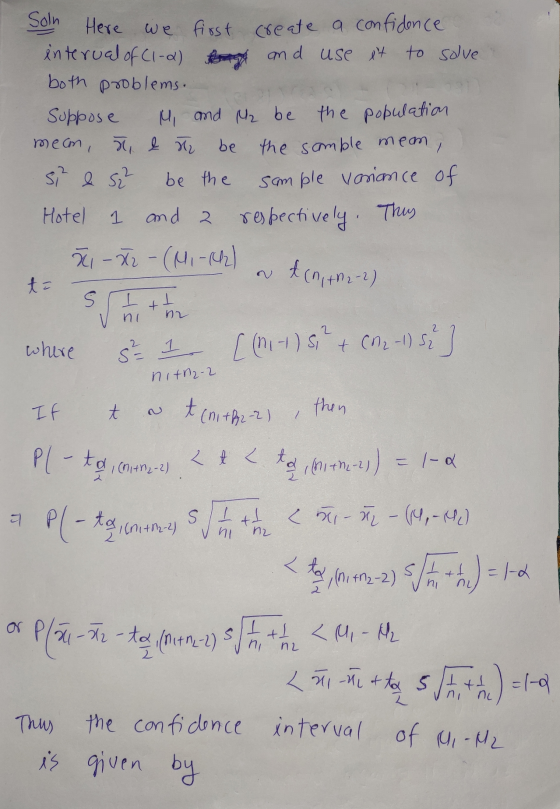
Suppose that we randomly select 50 billing statements from each of the computer databases of the Hotel A, the Hotel B, and the Hotel C chains, and record the nightly room rates. The means and standard deviations for the data are given in the table.
| Hotel A | Hotel B | Hotel C | |
|---|---|---|---|
| Sample Average ($) | 155 | 180 | 115 |
| Sample
Standard Deviation |
17.7 | 22.6 | 12.3 |
(a)
Find a 95% confidence interval for the difference in the average room rates for the Hotel A and the Hotel B chains. (Use Hotel A − Hotel B. Round your answers to two decimal places.)
$__________ to $___________
(b)
Find a 99% confidence interval for the difference in the average room rates for the Hotel B and the Hotel C chains. (Use Hotel B − Hotel C. Round your answers to two decimal places.)
$__________ to $___________
Homework Answers


Add Answer to:
Suppose that we randomly select 50 billing statements from each
of the computer databases of the...
7. (Four parts; 10 marks in total) A business survey randomly sampled 20 different hotels and...
 7. (Four parts; 10 marks in total) A business survey randomly sampled 20 different hotels and 20 different log cabins in British Columbia and recorded each of their nightly rates. The survey provided the following summary statistics regarding nightly rates in Canadian dollars. Differences Summary statistic Average Standard deviation Hotel rates 102.05 15.50 Log cabin rates 290.28 52.05 188.23 48.96 Note: Please note that the third column summarizes the differences between the original observations. By choosing a test, you will...
Random and independent samples of 95 recent prime time airings from each of two major networks...
 Random and independent samples of 95 recent prime time airings from each of two major networks have been considered. The first network aired a mean of 110.6 commercials during prime time, with a standard deviation of 4.3 commercials. The second network aired a mean of 109.4 commercials, with a standard deviation of 4.7 commercials. As the sample sizes are quite large, the population standard deviations can be estimated using the sample standard deviations. Construct a 95% confidence interval for Hly,...
Independent random samples were selected from two quantitative populations, with sample sizes, means, and standard deviations...
Independent random samples were selected from two quantitative populations, with sample sizes, means, and standard deviations given below. n1 = n2 = 60 x1 = 125.3 x2 = 123.4 s1 = 5.7 s2 = 6.1 a) Construct a 95% confidence interval for the difference in the population means (μ1 − μ2). (Round your answers to two decimal places.) to b) Find a point estimate for the difference in the population means. c) Calculate the margin of error. (Round your answer...
Suppose a new standardized test is given to 98 randomly selected third-grade students in New Jersey....
 Suppose a new standardized test is given to 98 randomly selected third-grade students in New Jersey. The sample average score Y on the test is 57 points, and the sample standard deviation, sy, is 10 points. The authors plan to administer the test to all third-grade students in New Jersey. The 95% confidence interval for the mean score of all New Jersey third graders is ( 55.02, 58.98 ). (Round your responses to two decimal places.) Suppose the same test...
You may need to use the appropriate appendix table or technology to answer this question Consider the following data for two independent random samples taken from two normal populations Sample 1 107...
 You may need to use the appropriate appendix table or technology to answer this question Consider the following data for two independent random samples taken from two normal populations Sample 1 107 146 9 8 Sample 28784510 (a) Compute the two sample means. Sample 1 Sample 2 (b) Compute the two sample standard deviations. (Round your answers to two decimal places.) Sample 1 Sample 2 (c) What is the point estimate of the difference between the two population means? (Use...
Suppose a sample of 49 paired differences that have been randomly selected from a normally distributed...
Suppose a sample of 49 paired differences that have been randomly selected from a normally distributed population of paired differences yields a sample mean d¯ =4.2 of and a sample standard deviation of sd = 7.6. (a) Calculate a 95 percent confidence interval for µd = µ1 – µ2. Can we be 95 percent confident that the difference between µ1 and µ2 is greater than 0? (Round your answers to 2 decimal places.) Confidence interval = [ ? , ?...
The human resources department of a consulting firm gives a standard creativity test to a randomly...
 The human resources department of a consulting firm gives a standard creativity test to a randomly selected group of new hires every year. This year, 70 new hires took the test and scored a mean of 113.3 points with a standard deviation of 16.2. Last year, 95 new hires took the test and scored a mean of 116.7 points with a standard deviation of 17.3. Assume that the population standard deviations of the test scores of all new hires in...
The human resources department of a consulting firm gives a standard creativity test to a randomly...
The human resources department of a consulting firm gives a standard creativity test to a randomly selected group of new hires every year. This year, 70 new hires took the test and scored a mean of 112.5 points with a standard deviation of 15.2. Last year, 55 new hires took the test and scored a mean of 117.5 points with a standard deviation of 18. Assume that the population standard deviations of the test scores of all new hires in...
Consider the following data for two independent random samples taken from two normal populations. Sample 1 10 7 13 7 9 8 Sample 2 9 7 8 4 5 9 (a) Compute the two sample means. Samp...
Consider the following data for two independent random samples taken from two normal populations. Sample 1 10 7 13 7 9 8 Sample 2 9 7 8 4 5 9 (a) Compute the two sample means. Sample 1Sample 2 (b) Compute the two sample standard deviations. (Round your answers to two decimal places.) Sample 1Sample 2 (c) What is the point estimate of the difference between the two population means? (Use Sample 1 − Sample 2.) (d) What is the...
A simple random sample of 50 items from a population with standard dev=7 resulted in a sample...
A simple random sample of 50 items from a population with standard dev=7 resulted in a sample mean of 36. If required, round your answers to two decimal places. a. Provide a 90% confidence interval for the population mean. to b. Provide a 95% confidence interval for the population mean. to c. Provide a 99% confidence interval for the population mean.
 7. (Four parts; 10 marks in total) A business survey randomly sampled 20 different hotels and 20 different log cabins in British Columbia and recorded each of their nightly rates. The survey provided the following summary statistics regarding nightly rates in Canadian dollars. Differences Summary statistic Average Standard deviation Hotel rates 102.05 15.50 Log cabin rates 290.28 52.05 188.23 48.96 Note: Please note that the third column summarizes the differences between the original observations. By choosing a test, you will...
 Random and independent samples of 95 recent prime time airings from each of two major networks have been considered. The first network aired a mean of 110.6 commercials during prime time, with a standard deviation of 4.3 commercials. The second network aired a mean of 109.4 commercials, with a standard deviation of 4.7 commercials. As the sample sizes are quite large, the population standard deviations can be estimated using the sample standard deviations. Construct a 95% confidence interval for Hly,...
 Suppose a new standardized test is given to 98 randomly selected third-grade students in New Jersey. The sample average score Y on the test is 57 points, and the sample standard deviation, sy, is 10 points. The authors plan to administer the test to all third-grade students in New Jersey. The 95% confidence interval for the mean score of all New Jersey third graders is ( 55.02, 58.98 ). (Round your responses to two decimal places.) Suppose the same test...
 You may need to use the appropriate appendix table or technology to answer this question Consider the following data for two independent random samples taken from two normal populations Sample 1 107 146 9 8 Sample 28784510 (a) Compute the two sample means. Sample 1 Sample 2 (b) Compute the two sample standard deviations. (Round your answers to two decimal places.) Sample 1 Sample 2 (c) What is the point estimate of the difference between the two population means? (Use...
 The human resources department of a consulting firm gives a standard creativity test to a randomly selected group of new hires every year. This year, 70 new hires took the test and scored a mean of 113.3 points with a standard deviation of 16.2. Last year, 95 new hires took the test and scored a mean of 116.7 points with a standard deviation of 17.3. Assume that the population standard deviations of the test scores of all new hires in...
Most questions answered within 3 hours.
-
Where is the error in this code sequence?
String s1 = "Hello";
String s2 = "ello";...
asked 10 months ago -
Financial data for Joel de Paris, Inc., for last year
follow:
Joel de Paris, Inc.
Balance...
asked 10 months ago -
Consider this reaction:
Al2(SO4)3 (aq)+ BaCl3
(aq) Al2Cl6 (aq)- +
3BaSO4(s) . What is the...
asked 10 months ago -
Suppose that Savneet is considering increasing her
recent random sample from 20 car rentals to 40...
asked 10 months ago -
Trucks arrive at an unloading terminal at an average rate of 120
per hour.
Trucks arrive...
asked 10 months ago -
Why are methanol and ethanol completely soluble in water while
octanol is not very little soluble....
asked 10 months ago -
A facilities manager at a university reads in a research report
that the mean amount of...
asked 10 months ago -
When the CuSO4 is rehydrated by adding water to the anhydrous
compound, is this an endothermic...
asked 10 months ago -
A ray of sunlight is passing from diamond into crown glass; the
angle of incidence is...
asked 10 months ago -
A block of mass 0.249 kg is placed on top of a light, vertical
spring of...
asked 10 months ago -
how do the kidneys compensate in the presences of acidosis
a) trigger hyperventilate
b) reserve acid...
asked 10 months ago -
Question 501 pts
The rental rate of capital to the firm increases. Which of the
following...
asked 10 months ago