
Homework Answers

Add Answer to:
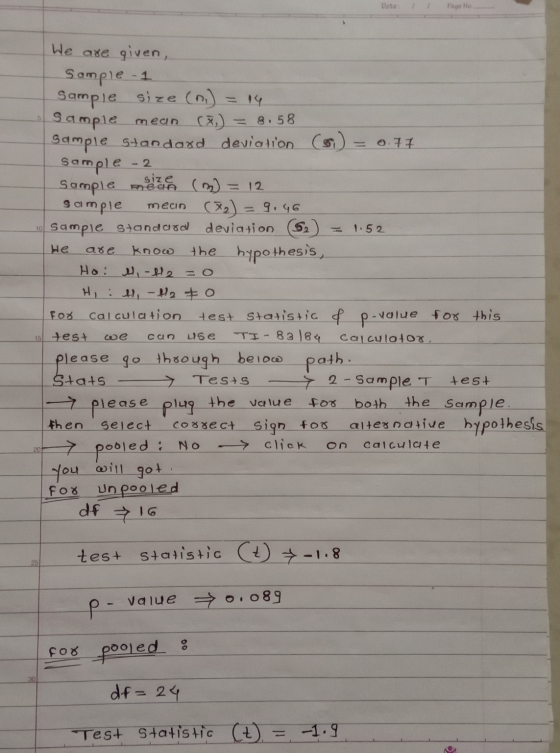
In an experiment to compare bearing strengths of pegs inserted in two different types of mounts,...
Consider independent random samples from two populations that are normal or approximately normal, or the case...
Consider independent random samples from two populations that are normal or approximately normal, or the case in which both sample sizes are at least 30. Then, if σ1 and σ2 are unknown but we have reason to believe that σ1 = σ2, we can pool the standard deviations. Using sample sizes n1 and n2, the sample test statistic x1 − x2 has a Student's t distribution where t = x1 − x2 s 1 n1 + 1 n2 with degrees...
Growth of Douglas fir seedlings. An experiment was conducted to compare the growth of Douglas fir...
Growth of Douglas fir seedlings. An experiment was conducted to compare the growth of Douglas fir seedlings under three different levels of vegetation control (0%, 50%, and 100%). Sixteen seedlings were randomized to each level of control. The resulting sample means for stem volume were 58, 73, and 105 cubic centimeters (cm3), respectively, with sp = 17 cm3. The researcher hypothesized that the average growth at 50% control would be less than the average of the 0% and 100% levels....
An experiment was conducted to compare the growth of Douglas fir seedlings under three different levels...
An experiment was conducted to compare the growth of Douglas fir seedlings under three different levels of vegetation control (0%, 50% and 100%). 16 seedlings were randomized to each level of control. The resulting sample means for stem volume were 58, 73, and 105 cubic centimetres (cm3), respectively with sp = 17 cm3. The researcher hypothesized that the average growth at 50% control would be less than the average age of the 0% and 100% levels. a. What are the...
In an experiment to compare the tensile strengths of I = 4 different types of copper...
 In an experiment to compare the tensile strengths of I = 4 different types of copper wire, ) = 3 samples of each type were used. The average between group and average within group estimates were computed as MST = 2676.3 and MSE = 1190.2, respectively. Often hypothesis tests are conducted using what is referred to as the rejection region method. This compares the calculated F test statistic to an F value that cuts off a "rejection region". If the...
1. In an experiment to compare the tensile strengths of 1 - 6 different types of...
 1. In an experiment to compare the tensile strengths of 1 - 6 different types of copper wire, ) = 5 samples of each type were used. The between-samples and within samples estimates of a were computed as MSTR = 2649.3 and MSE - 1169.2, respectively. Use the F test at level 0.05 to test Ho: H1 12 - ... - versus Ha: at least two wi's are unequal Calculate the test statistic (Round your answer to two decimal places.)...
You wish to compare the prices of apartments in two neighboring towns. You take a simple...
You wish to compare the prices of apartments in two neighboring towns. You take a simple random sample of 12 apartments in town A and calculate the average price of these apartments. You repeat this for 15 apartments in town B. Let μ1 represent the true average price of apartments in town A and μ2 the average price in town B. Suppose we were to use the unpooled t test with the conservative estimate for the degrees of freedom. The...
2. Assume that you have a sample of n = 8 with the sample mean X1...
 2. Assume that you have a sample of n = 8 with the sample mean X1 = 42 and a sample standard deviation Si = 4, and you have an independent sample of n2 = 15 from another population with a sample mean of X2 = 34 and a sample standard deviation S2 = 5. a. What is the value of the pooled-variance tsTAT test statistic for testing Ho H1 = H2? b. In finding the critical value, how many...
Given X, and x, distributions that are normal or approximately normal with unknown o, and on,...
 Given X, and x, distributions that are normal or approximately normal with unknown o, and on, the value of t corresponding to X, - X, has a distribution that is approximated by a Student's t distribution. We use the convention that the degrees of freedom is approximately the smaller of n - 1 and n, - 1. However, a more accurate estimate for the appropriate degrees of freedom is given by Satterthwaite's formula: 2 2 xn2 522 +$22) d.f. z...
In an experiment to compare the tensile strengths of I = 6 different types of copper...
In an experiment to compare the tensile strengths of I = 6 different types of copper wire, J = 5 samples of each type were used. The between-samples and within-samples estimates of σ2 were computed as MSTr = 2678.3 and MSE = 1188.2, respectively. Use the F test at level 0.05 to test H0: μ1 = μ2 = . . . = μ6 versus Ha: at least two μi's are unequal. 1. Calculate the test statistic. (Round your answer to...
16. In order to compare the means of two populations, independent random samples are selected from...
 16. In order to compare the means of two populations, independent random samples are selected from each population, with the following results. n 11, You are asked to use the pooled t-test to test 0.95, 0.049, 2 16, 20.61, s20.028 Find the observed value of the test statistic (a) 60.8873 with 25 degrees of freedom (b) t 85.0113 with 25 degrees of freedom. (c) 4.5499 with 25 degrees of freedom. (c) (d) None of the above.
 In an experiment to compare the tensile strengths of I = 4 different types of copper wire, ) = 3 samples of each type were used. The average between group and average within group estimates were computed as MST = 2676.3 and MSE = 1190.2, respectively. Often hypothesis tests are conducted using what is referred to as the rejection region method. This compares the calculated F test statistic to an F value that cuts off a "rejection region". If the...
 1. In an experiment to compare the tensile strengths of 1 - 6 different types of copper wire, ) = 5 samples of each type were used. The between-samples and within samples estimates of a were computed as MSTR = 2649.3 and MSE - 1169.2, respectively. Use the F test at level 0.05 to test Ho: H1 12 - ... - versus Ha: at least two wi's are unequal Calculate the test statistic (Round your answer to two decimal places.)...
 2. Assume that you have a sample of n = 8 with the sample mean X1 = 42 and a sample standard deviation Si = 4, and you have an independent sample of n2 = 15 from another population with a sample mean of X2 = 34 and a sample standard deviation S2 = 5. a. What is the value of the pooled-variance tsTAT test statistic for testing Ho H1 = H2? b. In finding the critical value, how many...
 Given X, and x, distributions that are normal or approximately normal with unknown o, and on, the value of t corresponding to X, - X, has a distribution that is approximated by a Student's t distribution. We use the convention that the degrees of freedom is approximately the smaller of n - 1 and n, - 1. However, a more accurate estimate for the appropriate degrees of freedom is given by Satterthwaite's formula: 2 2 xn2 522 +$22) d.f. z...
 16. In order to compare the means of two populations, independent random samples are selected from each population, with the following results. n 11, You are asked to use the pooled t-test to test 0.95, 0.049, 2 16, 20.61, s20.028 Find the observed value of the test statistic (a) 60.8873 with 25 degrees of freedom (b) t 85.0113 with 25 degrees of freedom. (c) 4.5499 with 25 degrees of freedom. (c) (d) None of the above.
Most questions answered within 3 hours.
-
Where is the error in this code sequence?
String s1 = "Hello";
String s2 = "ello";...
asked 11 months ago -
Financial data for Joel de Paris, Inc., for last year
follow:
Joel de Paris, Inc.
Balance...
asked 11 months ago -
Consider this reaction:
Al2(SO4)3 (aq)+ BaCl3
(aq) Al2Cl6 (aq)- +
3BaSO4(s) . What is the...
asked 11 months ago -
Suppose that Savneet is considering increasing her
recent random sample from 20 car rentals to 40...
asked 11 months ago -
Trucks arrive at an unloading terminal at an average rate of 120
per hour.
Trucks arrive...
asked 11 months ago -
Why are methanol and ethanol completely soluble in water while
octanol is not very little soluble....
asked 11 months ago -
A facilities manager at a university reads in a research report
that the mean amount of...
asked 11 months ago -
When the CuSO4 is rehydrated by adding water to the anhydrous
compound, is this an endothermic...
asked 11 months ago -
A ray of sunlight is passing from diamond into crown glass; the
angle of incidence is...
asked 11 months ago -
A block of mass 0.249 kg is placed on top of a light, vertical
spring of...
asked 11 months ago -
how do the kidneys compensate in the presences of acidosis
a) trigger hyperventilate
b) reserve acid...
asked 11 months ago -
Question 501 pts
The rental rate of capital to the firm increases. Which of the
following...
asked 11 months ago