
Homework Answers

느 - K L M N O Р Q R S B с D E F...
 느 - K L M N O Р Q R S B с D E F G H 4 A sample of households provided the following information about their Per Capita Income. 5 Use Excel to construct a percent frequency distribution table and graph. 6 Provide an appropriate label for each of the horizontal and vertical axes. 7 Make your first class "30,000-34,999" 8 Place the frequency distribution table and histogram within the highlighted box below. 9 Per Capita 10...
10. Below are 36 sorted ages of an acting award winner. Find Upper P10 using the...
10. Below are 36 sorted ages of an acting award winner. Find Upper P10 using the method presented in the textbook. 22 22 23 24 27 28 30 31 32 32 34 35 35 39 40 42 45 46 48 49 49 51 51 53 53 56 56 57 60 64 66 75 77 79 80 80 11. Find the third quartile Q3 of the list of 24 sorted values shown below 30 32 38 44 45 46 46 48...
А - B с D E F G H J K L Points 95% Confidence Interval...
 А - B с D E F G H J K L Points 95% Confidence Interval for Average Age of Online College Students: 1 Age 2 3 4 5 Sample Mean: Sample St. Dev: Sample Size: 31.29 10.18 21.9 mil 1 6 7 2 Distribution: T-Distribution 2 Critical Value: *2 decimals 2 1 1 Margin of Error: Lower Bound: Upper Bound: *2 decimals Calculation: *2 decimals Calculation: *2 decimals Calculation: 2 Interpret 95% Confidence interval for Proportion of Male Online...
Do the Academy Awards involve discrimination based on age? Listed below are the ages of actresses...
Do the Academy Awards involve discrimination based on age? Listed below are the ages of actresses and actors at the times that they won Oscars in the Best Actress and Best Actor categories. the ages are listed in order, beginning with the first Academy Awards ceremony in 1928. (Note: in 1968 there was a tie in the Best Actress category, and the mean of the two ages is used; in 1932 there was a tie in the Best Actor category,...
These are my instructions: Your data should have been read in from the data file and stored into ...
These are my instructions: Your data should have been read in from the data file and stored into an array. Next you need to calculate the following and display in a single Message box: Average score Highest score Lowest score Mode of the scores Your program should be written using methods and should be well documented internally and externally. Your output should be displayed using Message boxes. This is the .text file to use with the instructions: 20 21 22...
Consider the graph given above. Use Dijkstra's algorithm to find the shortest path between B and ...
 Consider the graph given above. Use Dijkstra's algorithm to find
the shortest path between B and O.
a. List the vertices in the order they are visited as specified
by the algorithm.
b. What is the total weight along the path?
52 41 G 26 14 H 12 50 35 44 15 9 47 8 37 38 42 29 H 32 51 30 19 46 48 43 18 34 17 0 13 F
52 41 G 26 14 H 12...
Consider the graph given above. Use Dijkstra's algorithm to find
the shortest path between B and O.
a. List the vertices in the order they are visited as specified
by the algorithm.
b. What is the total weight along the path?
52 41 G 26 14 H 12 50 35 44 15 9 47 8 37 38 42 29 H 32 51 30 19 46 48 43 18 34 17 0 13 F
52 41 G 26 14 H 12...
48 57 Amy Bakery has four shops in different area in a city. Monthly sales (in...
 48 57 Amy Bakery has four shops in different area in a city. Monthly sales (in thousands of dollars) from a random of 24 months from each of the 4 shops given in Table 1. Table 1: Monthly sales (in thousands of dollars) North East South West 77 75 97 60 45 42 60 54 56 49 68 47 44 39 58 57 63 61 69 51 75 63 79 50 90 81 99 73 32 47 46 41 41...
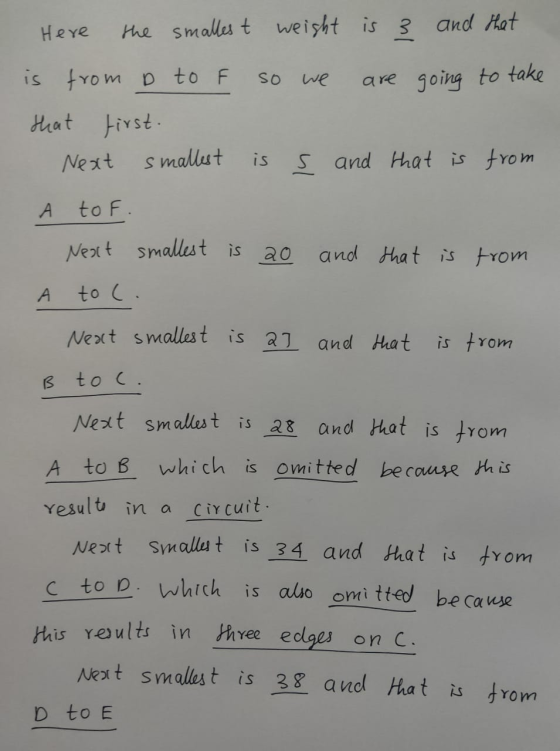
In this problem, you are expected to implement Prim's Algorithm on an undirected simple graph. Write...
 In this problem, you are expected to implement Prim's Algorithm on an undirected simple graph. Write a method that is part of a class that implements Graph as an adjacency matrix. This method should generate a minimum spanning tree using Prim's Algorithm, and print out the edge added by the algorithm on each iteration. 3 10 4 8 Output: 1 2 1 3 34 35 5 6 17 3 12 34 5 1 6 8 20 4 Output: 26 65...
PLEASE USE EXCEL. SCHOOL FINAL GRADE LAVC 85 A LAVC 46 D LAVC 50 D LAVC...
PLEASE USE EXCEL. SCHOOL FINAL GRADE LAVC 85 A LAVC 46 D LAVC 50 D LAVC 69 C LAVC 50 D LAVC 28 F LAVC 72 C LAVC 46 F LAVC 75 C LAVC 73 C LAVC 82 B LAVC 35 F LAVC 78 A LAVC 73 C LAVC 73 C LAVC 73 C LAVC 87 B LAVC 45 F LAVC 32 F LAVC 75 A LAVC 47 C LAVC 69 C LAVC 52 C LAVC 80 A LAVC 68...
 느 - K L M N O Р Q R S B с D E F G H 4 A sample of households provided the following information about their Per Capita Income. 5 Use Excel to construct a percent frequency distribution table and graph. 6 Provide an appropriate label for each of the horizontal and vertical axes. 7 Make your first class "30,000-34,999" 8 Place the frequency distribution table and histogram within the highlighted box below. 9 Per Capita 10...
 А - B с D E F G H J K L Points 95% Confidence Interval for Average Age of Online College Students: 1 Age 2 3 4 5 Sample Mean: Sample St. Dev: Sample Size: 31.29 10.18 21.9 mil 1 6 7 2 Distribution: T-Distribution 2 Critical Value: *2 decimals 2 1 1 Margin of Error: Lower Bound: Upper Bound: *2 decimals Calculation: *2 decimals Calculation: *2 decimals Calculation: 2 Interpret 95% Confidence interval for Proportion of Male Online...
 Consider the graph given above. Use Dijkstra's algorithm to find
the shortest path between B and O.
a. List the vertices in the order they are visited as specified
by the algorithm.
b. What is the total weight along the path?
52 41 G 26 14 H 12 50 35 44 15 9 47 8 37 38 42 29 H 32 51 30 19 46 48 43 18 34 17 0 13 F
52 41 G 26 14 H 12...
Consider the graph given above. Use Dijkstra's algorithm to find
the shortest path between B and O.
a. List the vertices in the order they are visited as specified
by the algorithm.
b. What is the total weight along the path?
52 41 G 26 14 H 12 50 35 44 15 9 47 8 37 38 42 29 H 32 51 30 19 46 48 43 18 34 17 0 13 F
52 41 G 26 14 H 12...
 48 57 Amy Bakery has four shops in different area in a city. Monthly sales (in thousands of dollars) from a random of 24 months from each of the 4 shops given in Table 1. Table 1: Monthly sales (in thousands of dollars) North East South West 77 75 97 60 45 42 60 54 56 49 68 47 44 39 58 57 63 61 69 51 75 63 79 50 90 81 99 73 32 47 46 41 41...
 In this problem, you are expected to implement Prim's Algorithm on an undirected simple graph. Write a method that is part of a class that implements Graph as an adjacency matrix. This method should generate a minimum spanning tree using Prim's Algorithm, and print out the edge added by the algorithm on each iteration. 3 10 4 8 Output: 1 2 1 3 34 35 5 6 17 3 12 34 5 1 6 8 20 4 Output: 26 65...
Most questions answered within 3 hours.
-
Where is the error in this code sequence?
String s1 = "Hello";
String s2 = "ello";...
asked 10 months ago -
Financial data for Joel de Paris, Inc., for last year
follow:
Joel de Paris, Inc.
Balance...
asked 10 months ago -
Consider this reaction:
Al2(SO4)3 (aq)+ BaCl3
(aq) Al2Cl6 (aq)- +
3BaSO4(s) . What is the...
asked 10 months ago -
Suppose that Savneet is considering increasing her
recent random sample from 20 car rentals to 40...
asked 10 months ago -
Trucks arrive at an unloading terminal at an average rate of 120
per hour.
Trucks arrive...
asked 10 months ago -
Why are methanol and ethanol completely soluble in water while
octanol is not very little soluble....
asked 10 months ago -
A facilities manager at a university reads in a research report
that the mean amount of...
asked 10 months ago -
When the CuSO4 is rehydrated by adding water to the anhydrous
compound, is this an endothermic...
asked 10 months ago -
A ray of sunlight is passing from diamond into crown glass; the
angle of incidence is...
asked 10 months ago -
A block of mass 0.249 kg is placed on top of a light, vertical
spring of...
asked 10 months ago -
how do the kidneys compensate in the presences of acidosis
a) trigger hyperventilate
b) reserve acid...
asked 10 months ago -
Question 501 pts
The rental rate of capital to the firm increases. Which of the
following...
asked 10 months ago