
Homework Answers
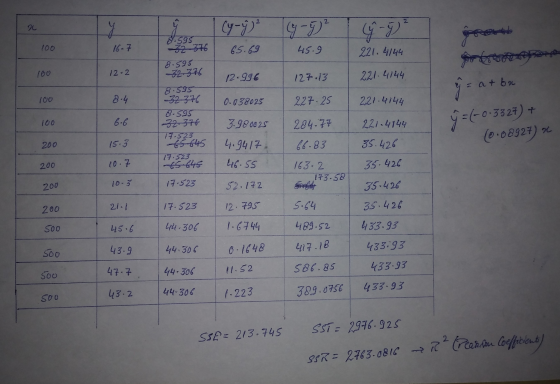
From the given data, the mean x and mean y are calculated. Using the linear regression model, the coefficients a and b for the best fit are determined. Once a and b are known, the y^ is determined and also the other as asked in the table. Finally SSE, SST and SSR are calculated.

Add Answer to:
2. Using the following data set find a prediction equation ( 9 = ax + b)...
9 (y - y)(y - )? (9 - 7) 100 100 100 100 200 200 200...
 9 (y - y)(y - )? (9 - 7) 100 100 100 100 200 200 200 200 500 500 500 500 16.7 12.2 8.4 6.6 15.3 10.71 10.3 21.1 45.6 43.9 47.7 43.2 SSE SST SSR 3. Complete all remaining columns of the table above using the regression equation you found and then find the sum of squared values (SSE, SST and SSR). Complete the given ANOVA table and comment whether the regression coefficient related to the factor's main effect...
b) SST=? C) SSE=? SSR=? Consider the following set of ordered pairs. Complete parts a through...
 b) SST=?
C) SSE=?
SSR=?
Consider the following set of ordered pairs. Complete parts a through c. х 1 2 6 5 5 40 7 у 5 a. Calculate the slope and y-intercept for these data. Ÿ= + ( X (Round to four decimal places as needed.)
b) SST=?
C) SSE=?
SSR=?
Consider the following set of ordered pairs. Complete parts a through c. х 1 2 6 5 5 40 7 у 5 a. Calculate the slope and y-intercept for these data. Ÿ= + ( X (Round to four decimal places as needed.)
QUESTION 7 The data set Beer Large, which can be found in StatCrunch Shared Data Sets,...
 QUESTION 7 The data set Beer Large, which can be found in StatCrunch Shared Data Sets, gives the Alcohol, Carbohydrates and Calories for different brands of beer. The explanatory variable is x + Carbohydrates and the response variable is Y - Calories. Use this information to answer: Calculate the correlation between carbohydrates and calories. (4 decimal places) Row vars varo var var 8 var9 var 10 2 الميا ABV 4.1 5.4 4.43 4.13 5.9 4.9 Carbs 2.6 13.7 5.8 5...
CASE 1-5 Financial Statement Ratio Computation Refer to Campbell Soup Company's financial Campbell Soup statements in...
 CASE 1-5 Financial Statement Ratio Computation Refer to Campbell Soup Company's financial Campbell Soup statements in Appendix A. Required: Compute the following ratios for Year 11. Liquidity ratios: Asset utilization ratios:* a. Current ratio n. Cash turnover b. Acid-test ratio 0. Accounts receivable turnover c. Days to sell inventory p. Inventory turnover d. Collection period 4. Working capital turnover Capital structure and solvency ratios: 1. Fixed assets turnover e. Total debt to total equity s. Total assets turnover f. Long-term...
 9 (y - y)(y - )? (9 - 7) 100 100 100 100 200 200 200 200 500 500 500 500 16.7 12.2 8.4 6.6 15.3 10.71 10.3 21.1 45.6 43.9 47.7 43.2 SSE SST SSR 3. Complete all remaining columns of the table above using the regression equation you found and then find the sum of squared values (SSE, SST and SSR). Complete the given ANOVA table and comment whether the regression coefficient related to the factor's main effect...
 b) SST=?
C) SSE=?
SSR=?
Consider the following set of ordered pairs. Complete parts a through c. х 1 2 6 5 5 40 7 у 5 a. Calculate the slope and y-intercept for these data. Ÿ= + ( X (Round to four decimal places as needed.)
b) SST=?
C) SSE=?
SSR=?
Consider the following set of ordered pairs. Complete parts a through c. х 1 2 6 5 5 40 7 у 5 a. Calculate the slope and y-intercept for these data. Ÿ= + ( X (Round to four decimal places as needed.)
 QUESTION 7 The data set Beer Large, which can be found in StatCrunch Shared Data Sets, gives the Alcohol, Carbohydrates and Calories for different brands of beer. The explanatory variable is x + Carbohydrates and the response variable is Y - Calories. Use this information to answer: Calculate the correlation between carbohydrates and calories. (4 decimal places) Row vars varo var var 8 var9 var 10 2 الميا ABV 4.1 5.4 4.43 4.13 5.9 4.9 Carbs 2.6 13.7 5.8 5...
 CASE 1-5 Financial Statement Ratio Computation Refer to Campbell Soup Company's financial Campbell Soup statements in Appendix A. Required: Compute the following ratios for Year 11. Liquidity ratios: Asset utilization ratios:* a. Current ratio n. Cash turnover b. Acid-test ratio 0. Accounts receivable turnover c. Days to sell inventory p. Inventory turnover d. Collection period 4. Working capital turnover Capital structure and solvency ratios: 1. Fixed assets turnover e. Total debt to total equity s. Total assets turnover f. Long-term...
Most questions answered within 3 hours.
-
Where is the error in this code sequence?
String s1 = "Hello";
String s2 = "ello";...
asked 11 months ago -
Financial data for Joel de Paris, Inc., for last year
follow:
Joel de Paris, Inc.
Balance...
asked 11 months ago -
Consider this reaction:
Al2(SO4)3 (aq)+ BaCl3
(aq) Al2Cl6 (aq)- +
3BaSO4(s) . What is the...
asked 11 months ago -
Suppose that Savneet is considering increasing her
recent random sample from 20 car rentals to 40...
asked 11 months ago -
Trucks arrive at an unloading terminal at an average rate of 120
per hour.
Trucks arrive...
asked 11 months ago -
Why are methanol and ethanol completely soluble in water while
octanol is not very little soluble....
asked 11 months ago -
A facilities manager at a university reads in a research report
that the mean amount of...
asked 11 months ago -
When the CuSO4 is rehydrated by adding water to the anhydrous
compound, is this an endothermic...
asked 11 months ago -
A ray of sunlight is passing from diamond into crown glass; the
angle of incidence is...
asked 11 months ago -
A block of mass 0.249 kg is placed on top of a light, vertical
spring of...
asked 11 months ago -
how do the kidneys compensate in the presences of acidosis
a) trigger hyperventilate
b) reserve acid...
asked 11 months ago -
Question 501 pts
The rental rate of capital to the firm increases. Which of the
following...
asked 11 months ago