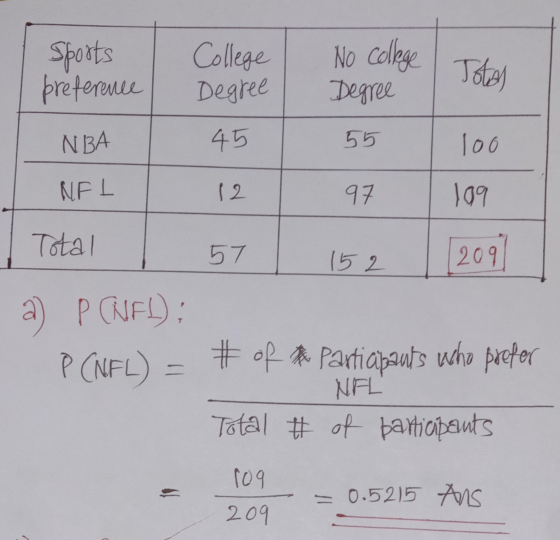
A marketing company has randomly surveyed 209 men who watch professional sports. The men were separated...
| A marketing company has randomly surveyed
209 men who watch professional sports. The men were separated according to their educational level (college degree or not) and whether they preferred the NBA or the National Football League (NFL). The results of the survey are shown to the right. Complete parts a through d. |
|
a. What is the probability that a randomly selected survey participant prefers the NFL?
nothing
(Round to four decimal places as needed.)
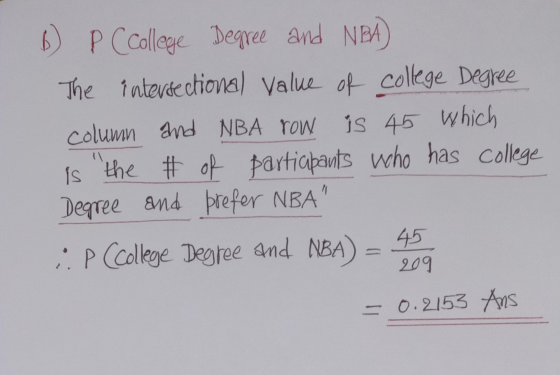
b. What is the probability that a randomly selected survey participant has a college degree and prefers the NBA?
nothing
(Round to four decimal places as needed.)
c. Suppose a survey participant is randomly selected and you are told that he has a college degree. What is the probability that this man prefers the NFL?
nothing
(Round to four decimal places as needed.)
Homework Answers

Add Answer to:
A marketing company has randomly surveyed
209
men who watch professional sports. The men were separated...
A bicycle company makes two mountain bike models that each come in three colors. Use the...
A bicycle company makes two mountain bike models that each come in three colors. Use the following table, which shows the production volumes for one week, to answer parts a through d. Color Model Blue Brown White XK-50 296 85 204 HD-99 46 210 132 a. Based on the relative frequency assessment method, what is the probability that a manufactured item is brown? P(brown)= (Round to four decimal places as needed.) b. What is the probability that the product manufactured...
In a survey of a group of men, the heights in the 20-29 age group were...
In a survey of a group of men, the heights in the 20-29 age group were normally distributed, with a mean of 67.3 inches and a standard deviation of 4.0 inches. A study participant is randomly selected. Complete parts (a) through (d) below. (a) Find the probability that a study participant has a height that is less than 68 inches. The probability that the study participant selected at random is less than 68 inches tall is nothing . (Round to...
In a survey of a group of? men, the heights in the? 20-29 age group were...
In a survey of a group of? men, the heights in the? 20-29 age group were normally? distributed, with a mean of 67.567.5 inches and a standard deviation of 2.02.0 inches. A study participant is randomly selected. Complete parts? (a) through? (d) below. ?(a) Find the probability that a study participant has a height that is less than 6565 inches.The probability that the study participant selected at random is less than 6565 inches tall is nothing . ?(Round to four...
In a survey of a group of men, the heights in the 20-29 age group were...
In a survey of a group of men, the heights in the 20-29 age group were normally distributed, with a mean of 69.3 inches and a standard deviation of 3.0 inches. A study participant is randomly selected. Complete parts (a) through (d) below. (a) Find the probability that a study participant has a height that is less than 65 inches. The probability that the study participant selected at random is less than 65 inches tall is nothing. (Round to four...
In a survey of a group of men, the heights in the 20-29 age group were...
 In a survey of a group of men, the heights in the 20-29 age group were normally distributed, with a mean of 68.4 inches and a standard deviation of 2.0 ind study participant is randomly selected. Complete parts (a) through (d) below. (a) Find the probability that a study participant has a height that is less than 68 inches. The probability that the study participant selected at random is less than 68 inches tall is 4207. (Round to four decimal...
In a survey of a group of men, the heights in the 20-29 age group were...
 In a survey of a group of men, the heights in the 20-29 age group were normally distributed, with a mean of 68.8 inches and a standard deviation of 3.0 inches. A study participant is randomly selected. Complete parts (a) through (d) below. (a) Find the probability that a study participant has a height that is less than 65 inches The probability that the study participant selected at random is less than 65 inches tall is (Round to four decimal...
In a survey of a group of men, the heights in the 20-29 age group were...
 In a survey of a group of men, the heights in the 20-29 age group were normally distributed, with a mean of 68.9 inches and a standard deviation of 4.0 inches. A study participant is randomly selected. Complete parts (a) through (d) below. (a) Find the probability that a study participant has a height that is less than 66 inches. The probability that the study participant selected at random is less than 66 inches tall is (Round to four decimal...
In a survey of a group of men, the heights in the 20-29 age group were...
 In a survey of a group of men, the heights in the 20-29 age group were normally distributed with a mean of 696 inches and a standard deviation of 20 inches. A study participantis randomly selected Complete parts (a) through (d) below. (a) Find the probability that a study participant has a height that is less than 67 inches The probability that the study participant selected at random is less than 67 inches tall is (Round to four decimal places...
In a survey of a group of men, the heights in the 20-29 age group were...
 In a survey of a group of men, the heights in the 20-29 age group were normally distibuted, with a mean of 69 7 inches and a standard deviation of 3.0 inches. A study participant is randomly selected. Complete parts (a) through (d) below (a) Find the probability that a study participant has a height that is less than 66 inches The probability that the study participant selected at random is less than 66 inches tall is Roun to four...
30 In a survey of a group of men, the heights in the 20-29 age group...
 30
In a survey of a group of men, the heights in the 20-29 age group were normally distributed with a mean of 689 inches and a standard deviation of 4.0 inches. A study participant is randomly selected. Complete parts (a) through (d) below. (a) Find the probability that a study participant has a height that is less than 68 inches The probability that the study participant selected at random is less than 68 inches tall is (Round to four...
30
In a survey of a group of men, the heights in the 20-29 age group were normally distributed with a mean of 689 inches and a standard deviation of 4.0 inches. A study participant is randomly selected. Complete parts (a) through (d) below. (a) Find the probability that a study participant has a height that is less than 68 inches The probability that the study participant selected at random is less than 68 inches tall is (Round to four...
 In a survey of a group of men, the heights in the 20-29 age group were normally distributed, with a mean of 68.4 inches and a standard deviation of 2.0 ind study participant is randomly selected. Complete parts (a) through (d) below. (a) Find the probability that a study participant has a height that is less than 68 inches. The probability that the study participant selected at random is less than 68 inches tall is 4207. (Round to four decimal...
 In a survey of a group of men, the heights in the 20-29 age group were normally distributed, with a mean of 68.8 inches and a standard deviation of 3.0 inches. A study participant is randomly selected. Complete parts (a) through (d) below. (a) Find the probability that a study participant has a height that is less than 65 inches The probability that the study participant selected at random is less than 65 inches tall is (Round to four decimal...
 In a survey of a group of men, the heights in the 20-29 age group were normally distributed, with a mean of 68.9 inches and a standard deviation of 4.0 inches. A study participant is randomly selected. Complete parts (a) through (d) below. (a) Find the probability that a study participant has a height that is less than 66 inches. The probability that the study participant selected at random is less than 66 inches tall is (Round to four decimal...
 In a survey of a group of men, the heights in the 20-29 age group were normally distributed with a mean of 696 inches and a standard deviation of 20 inches. A study participantis randomly selected Complete parts (a) through (d) below. (a) Find the probability that a study participant has a height that is less than 67 inches The probability that the study participant selected at random is less than 67 inches tall is (Round to four decimal places...
 In a survey of a group of men, the heights in the 20-29 age group were normally distibuted, with a mean of 69 7 inches and a standard deviation of 3.0 inches. A study participant is randomly selected. Complete parts (a) through (d) below (a) Find the probability that a study participant has a height that is less than 66 inches The probability that the study participant selected at random is less than 66 inches tall is Roun to four...
 30
In a survey of a group of men, the heights in the 20-29 age group were normally distributed with a mean of 689 inches and a standard deviation of 4.0 inches. A study participant is randomly selected. Complete parts (a) through (d) below. (a) Find the probability that a study participant has a height that is less than 68 inches The probability that the study participant selected at random is less than 68 inches tall is (Round to four...
30
In a survey of a group of men, the heights in the 20-29 age group were normally distributed with a mean of 689 inches and a standard deviation of 4.0 inches. A study participant is randomly selected. Complete parts (a) through (d) below. (a) Find the probability that a study participant has a height that is less than 68 inches The probability that the study participant selected at random is less than 68 inches tall is (Round to four...
Most questions answered within 3 hours.
-
Where is the error in this code sequence?
String s1 = "Hello";
String s2 = "ello";...
asked 11 months ago -
Financial data for Joel de Paris, Inc., for last year
follow:
Joel de Paris, Inc.
Balance...
asked 11 months ago -
Consider this reaction:
Al2(SO4)3 (aq)+ BaCl3
(aq) Al2Cl6 (aq)- +
3BaSO4(s) . What is the...
asked 11 months ago -
Suppose that Savneet is considering increasing her
recent random sample from 20 car rentals to 40...
asked 11 months ago -
Trucks arrive at an unloading terminal at an average rate of 120
per hour.
Trucks arrive...
asked 11 months ago -
Why are methanol and ethanol completely soluble in water while
octanol is not very little soluble....
asked 11 months ago -
A facilities manager at a university reads in a research report
that the mean amount of...
asked 11 months ago -
When the CuSO4 is rehydrated by adding water to the anhydrous
compound, is this an endothermic...
asked 11 months ago -
A ray of sunlight is passing from diamond into crown glass; the
angle of incidence is...
asked 11 months ago -
A block of mass 0.249 kg is placed on top of a light, vertical
spring of...
asked 11 months ago -
how do the kidneys compensate in the presences of acidosis
a) trigger hyperventilate
b) reserve acid...
asked 11 months ago -
Question 501 pts
The rental rate of capital to the firm increases. Which of the
following...
asked 11 months ago