

Homework Answers


Add Answer to:
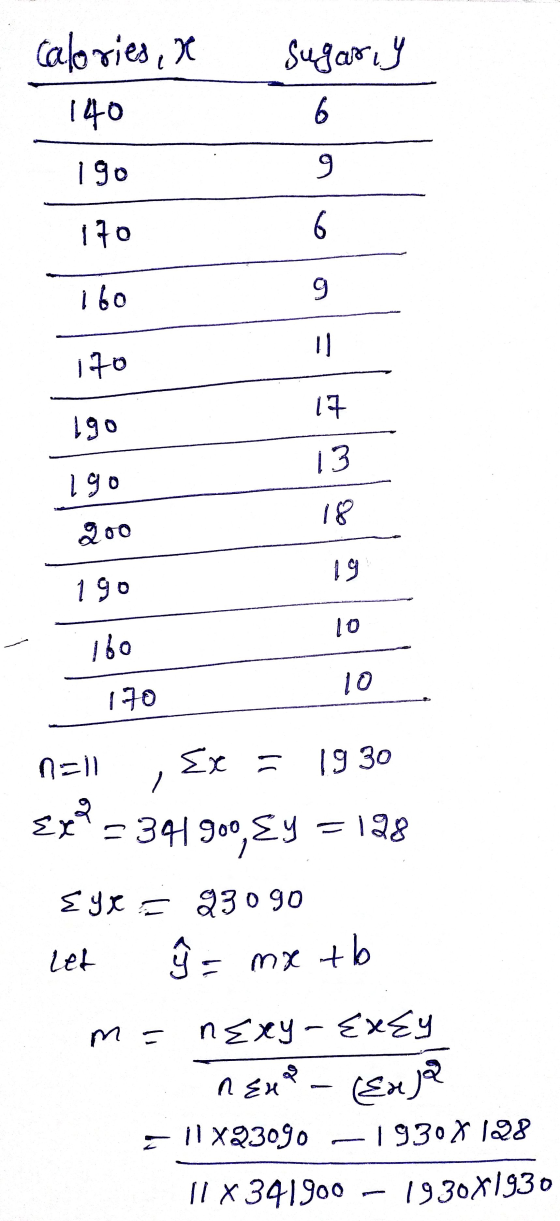
The accompanying data are the coloris contents and the sugar content in grof 11 high fiber...
> The accompanying data are the number of wins and the earned run averages (mean number...
 > The accompanying data are the number of wins and the earned run averages (mean number of earned runs allowed per nine innings pitched) for eight baseball pitchers in a recent season. Find the equation of the regression line. Then construct a scatter plot of the data and draw the regression line. Then use the regression equation to predict the value of y for each of the given x-values, if meaningful. If the x-value is not meaningful to predict the...
Find the equation of the regression line for the given data. Then construet a scatter plot...
 Find the equation of the regression line for the given data. Then construet a scatter plot of the data and draw the regression line. (Each pair of variables has a significant corrlaton.) Then use the regression equation to predict the value of y for each of the given x-valu meaningful. The caloric content and the sodium content (in milligrams) for 6 beef hot dogs are shown in the table below. 120 330 alories, x odium 160 430 190 520 (a)...
Find the equation of the regression line for the given data. Then construct a scatter plot of the data and draw the regression line. (Each pair of variables has a significant correlation.) Then use t...
 Find the equation of the regression line for the given data. Then construct a scatter plot of the data and draw the regression line. (Each pair of variables has a significant correlation.) Then use the regression equation to predict the value of y for each of the given x-values, if meaningful. The caloric content and the sodium content (in milligrams) for 6 beef hot dogs are shown in the table below. 120 340 120 370 (a) x 180 calories (c)...
The accompanying data are the number of wins and the earned run averages (mean number of...
The accompanying data are the number of wins and the earned run averages (mean number of earned runs allowed per nine innings pitched) for eight baseball pitchers in a recent season. Find the equation of the regression line. Then construct a scatter plot of the data and draw the regression line. Then use the regression equation to predict the value of y for each of the given x-values, if meaningful. If the x-value is not meaningful to predict the value...
can i get help answering these questions please i cant seem to undestand how to solve...
 can i get help answering these questions please i cant seem to
undestand how to solve
Find the equation of the regression line for the given data. The construct a scatter plot of the data and draw the regression in Each of the has a signifantomation) Then use the regression in to pred value ofy for each of the given to meaning. The color content and the sodium content in migrans) forte he dogs are shown in the late to...
can i get help answering these questions please i cant seem to
undestand how to solve
Find the equation of the regression line for the given data. The construct a scatter plot of the data and draw the regression in Each of the has a signifantomation) Then use the regression in to pred value ofy for each of the given to meaning. The color content and the sodium content in migrans) forte he dogs are shown in the late to...
The accompanying data are the number of wins and the earned run averages (mean number of earned runs allowed per nine innings pitched) for eight baseball pitchers in a recent season. Find the equati...
The accompanying data are the number of wins and the earned run averages (mean number of earned runs allowed per nine innings pitched) for eight baseball pitchers in a recent season. Find the equation of the regression line. Then construct a scatter plot of the data and draw the regression line. Then use the regression equation to predict the value of y for each of the given x-values, if meaningful. If the x-value is not meaningful to predict the value...
Find the equation of the regression line for the given data. Then construct a scatter plot...
 Find the equation of the regression line for the given data. Then construct a scatter plot of the data and draw the regression line (Each pair of variables has a significant correlation.) Then use the regression equation to predict the value of y for each of the given x-values, if meaningful. The caloric content and the sodium content (in milligrams) for 6 beef hot dogs are shown in the table below. Calories, x 150 170 130 120 90 180 (a)...
This is one question divided in A B4cC and D. Thank you | 10 of 10...
 This is one question divided in A B4cC and D. Thank
you
| 10 of 10 (6 complete) ▼ i Lengths and Girths Length, xGirth, y 137 168 153 146 159 159 123 136 154 148 148 147 105 129 116 106 125 118 104 103 121 109 107 108 iz. Criapicr 10 of 10(6 The accompanying data are the length (in centimeters) and girths (in centimeters) of 12 harbor seals Find the equation of the regression line. Then construct...
This is one question divided in A B4cC and D. Thank
you
| 10 of 10 (6 complete) ▼ i Lengths and Girths Length, xGirth, y 137 168 153 146 159 159 123 136 154 148 148 147 105 129 116 106 125 118 104 103 121 109 107 108 iz. Criapicr 10 of 10(6 The accompanying data are the length (in centimeters) and girths (in centimeters) of 12 harbor seals Find the equation of the regression line. Then construct...
Find the equation of the regression line for the given data. Then construct a scatter plot...
Find the equation of the regression line for the given data. Then construct a scatter plot of the data and draw the regression line. (Each pair of variables has a significant correlation.) Then use the regression equation to predict the value of y for each of the given x-values, if meaningful. The caloric content and the sodium content (in milligrams) for 6 beef hot dogs are shown in the table below. (a)x=180 (b)x=90 (c)x=120 (d)x=50 Calories, x Sodium, y 150 ...
0 Find the equation of the regression line for the given data. The construct a scatter...
 0 Find the equation of the regression line for the given data. The construct a scatter plot of the date and draw the regression in (The pair of we have a significant corelation) Then use the regression equation to predict the value ofy for each of the given x-vous meaningful. The table below shows the heights on tool and the number of stories of si notable buildings in a city Helght, 775 510 500 (0) 500 fot b)x500 Stories 37...
 > The accompanying data are the number of wins and the earned run averages (mean number of earned runs allowed per nine innings pitched) for eight baseball pitchers in a recent season. Find the equation of the regression line. Then construct a scatter plot of the data and draw the regression line. Then use the regression equation to predict the value of y for each of the given x-values, if meaningful. If the x-value is not meaningful to predict the...
 Find the equation of the regression line for the given data. Then construet a scatter plot of the data and draw the regression line. (Each pair of variables has a significant corrlaton.) Then use the regression equation to predict the value of y for each of the given x-valu meaningful. The caloric content and the sodium content (in milligrams) for 6 beef hot dogs are shown in the table below. 120 330 alories, x odium 160 430 190 520 (a)...
 Find the equation of the regression line for the given data. Then construct a scatter plot of the data and draw the regression line. (Each pair of variables has a significant correlation.) Then use the regression equation to predict the value of y for each of the given x-values, if meaningful. The caloric content and the sodium content (in milligrams) for 6 beef hot dogs are shown in the table below. 120 340 120 370 (a) x 180 calories (c)...
 can i get help answering these questions please i cant seem to
undestand how to solve
Find the equation of the regression line for the given data. The construct a scatter plot of the data and draw the regression in Each of the has a signifantomation) Then use the regression in to pred value ofy for each of the given to meaning. The color content and the sodium content in migrans) forte he dogs are shown in the late to...
can i get help answering these questions please i cant seem to
undestand how to solve
Find the equation of the regression line for the given data. The construct a scatter plot of the data and draw the regression in Each of the has a signifantomation) Then use the regression in to pred value ofy for each of the given to meaning. The color content and the sodium content in migrans) forte he dogs are shown in the late to...
 Find the equation of the regression line for the given data. Then construct a scatter plot of the data and draw the regression line (Each pair of variables has a significant correlation.) Then use the regression equation to predict the value of y for each of the given x-values, if meaningful. The caloric content and the sodium content (in milligrams) for 6 beef hot dogs are shown in the table below. Calories, x 150 170 130 120 90 180 (a)...
 This is one question divided in A B4cC and D. Thank
you
| 10 of 10 (6 complete) ▼ i Lengths and Girths Length, xGirth, y 137 168 153 146 159 159 123 136 154 148 148 147 105 129 116 106 125 118 104 103 121 109 107 108 iz. Criapicr 10 of 10(6 The accompanying data are the length (in centimeters) and girths (in centimeters) of 12 harbor seals Find the equation of the regression line. Then construct...
This is one question divided in A B4cC and D. Thank
you
| 10 of 10 (6 complete) ▼ i Lengths and Girths Length, xGirth, y 137 168 153 146 159 159 123 136 154 148 148 147 105 129 116 106 125 118 104 103 121 109 107 108 iz. Criapicr 10 of 10(6 The accompanying data are the length (in centimeters) and girths (in centimeters) of 12 harbor seals Find the equation of the regression line. Then construct...
 0 Find the equation of the regression line for the given data. The construct a scatter plot of the date and draw the regression in (The pair of we have a significant corelation) Then use the regression equation to predict the value ofy for each of the given x-vous meaningful. The table below shows the heights on tool and the number of stories of si notable buildings in a city Helght, 775 510 500 (0) 500 fot b)x500 Stories 37...
Most questions answered within 3 hours.
-
Where is the error in this code sequence?
String s1 = "Hello";
String s2 = "ello";...
asked 11 months ago -
Financial data for Joel de Paris, Inc., for last year
follow:
Joel de Paris, Inc.
Balance...
asked 11 months ago -
Consider this reaction:
Al2(SO4)3 (aq)+ BaCl3
(aq) Al2Cl6 (aq)- +
3BaSO4(s) . What is the...
asked 11 months ago -
Suppose that Savneet is considering increasing her
recent random sample from 20 car rentals to 40...
asked 11 months ago -
Trucks arrive at an unloading terminal at an average rate of 120
per hour.
Trucks arrive...
asked 11 months ago -
Why are methanol and ethanol completely soluble in water while
octanol is not very little soluble....
asked 11 months ago -
A facilities manager at a university reads in a research report
that the mean amount of...
asked 11 months ago -
When the CuSO4 is rehydrated by adding water to the anhydrous
compound, is this an endothermic...
asked 11 months ago -
A ray of sunlight is passing from diamond into crown glass; the
angle of incidence is...
asked 11 months ago -
A block of mass 0.249 kg is placed on top of a light, vertical
spring of...
asked 11 months ago -
how do the kidneys compensate in the presences of acidosis
a) trigger hyperventilate
b) reserve acid...
asked 11 months ago -
Question 501 pts
The rental rate of capital to the firm increases. Which of the
following...
asked 11 months ago