


Homework Answers
b)
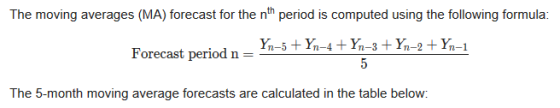


![11 182 169.8 | 182 169.8 = 12.2 12 149 170 | 149- 170 = 21 13 153 1678 | 153 167.8|| 14.8 14 164 163.2 | 164- 163.2] = 0.8 15](http://img.homeworklib.com/questions/8ae11120-ed9f-11ea-bf65-d746edb19206.png?x-oss-process=image/resize,w_560)
c)
d)
demand for period 17 is

Add Answer to:
Respond to each of the items using the following time series data. Period 1 2 3...
Serum Systolic Serum Systolic Serum Systolic Serum Systolic Serum Systolic 04 137 183115 218 145 209 170 195 115 Question 1a: Data a. Use the proportion from question 1a. Test the claim that t...
 Serum Systolic Serum Systolic Serum Systolic Serum Systolic Serum Systolic 04 137 183115 218 145 209 170 195 115 Question 1a: Data a. Use the proportion from question 1a. Test the claim that the Sample 153 127 193 146 173 194 163 201...-174--157 proportion of Asianssi-s than 25%, use 219 ; 1191 163 160 174,160 140 Proportion 0.2 Critical Value 1.645 Margin of Error 0.0658 144 140 145 177 152166175 200 131 Hypotheses: You may write HO and Hl Test...
An analyst is using exponential smoothing to forecast the daily demand for a key product. The...
An analyst is using exponential smoothing to forecast the daily demand for a key product. The analyst starts with a naive forecast for time period 2, then begins using exponential smoothing with a smoothing constant of 0.15. The table below shows some of the calculations. period actual forecast 1 125 2 136 125 3 144 126.65 4 157 129.25 5 181 ? What is the predicted demand for time period 5? Round your answer to two decimal places. Period Actual...
Maintaining a healthy weight is important for women’s health. Some physicians recommend being back to your...
Maintaining a healthy weight is important for women’s health. Some physicians recommend being back to your pre-pregnancy weight six months after giving birth. Public health officials are interested in whether this is a realistic goal. Do the women in North Carolina weigh more than their pre-pregnancy weight six months postpartum? In other words, is the six months post-pregnancy weight greater than their pre-pregnancy weight? Use a paired samples t-test to compare pst6wght (variable 1) and prewght (variable 2). This uses...
Given the series of demand data below Period: 1 2 3 4 5 6 7 8...
Given the series of demand data below Period: 1 2 3 4 5 6 7 8 9 10 Demand: 45 35 51 43 22 50 36 38 26 37 a. Calculate the forecasts for periods 7 through 11 using moving average models with n = 2, n = 4, and n = 6. Week n=2 n=4 n=6 7 8 9 10 11 b. Calculate the bias and MAD for each set of forecasts. (Negative answers should be indicated by a...
You will start by considering the data set in the proj2-2.txt file on BlackBoard. The data set contains SEX (1=female; 2=male), PEFR in l/min and height in cm. 1. Make a scatter plot of PEFR versus...
You will start by considering the data set in the proj2-2.txt file on BlackBoard. The data set contains SEX (1=female; 2=male), PEFR in l/min and height in cm. 1. Make a scatter plot of PEFR versus height. 2. Fit the simple linear regression of PEFR on height. 3. What is the estimated slope (with CI) and the interpretation of this estimate. 4. What is the standard deviation around the line (with CI) and the interpretation of this estimate. 5. Estimate...
An analyst must decide between two different forecasting techniques for weekly sales of roller blades: a...
 An analyst must decide between two different forecasting techniques for weekly sales of roller blades: a linear trend equation and the naive approach. The linear trend equation is Ft = 124 + 2.1t, and it was developed using data from periods 1 through 10. Based on data for periods 11 through 20 as shown in the table, which of these two methods has the greater accuracy if MAD and MSE are used? (Round your intermediate calculations and final answers to...
Consider the following Time Series. Consider the following time series. eri Demand 66 6 9 13 14 1 13 a) Using a trend projection, forecast the demand for Period 9. b) Calculate the MAD for this forec...
 Consider the following Time Series.
Consider the following time series. eri Demand 66 6 9 13 14 1 13 a) Using a trend projection, forecast the demand for Period 9. b) Calculate the MAD for this forecast.
Consider the following time series. eri Demand 66 6 9 13 14 1 13 a) Using a trend projection, forecast the demand for Period 9. b) Calculate the MAD for this forecast.
Consider the following Time Series.
Consider the following time series. eri Demand 66 6 9 13 14 1 13 a) Using a trend projection, forecast the demand for Period 9. b) Calculate the MAD for this forecast.
Consider the following time series. eri Demand 66 6 9 13 14 1 13 a) Using a trend projection, forecast the demand for Period 9. b) Calculate the MAD for this forecast.
The following data are from a completely randomized design. Treatment 164 149 142 157 167 124...
 The following data are from a completely randomized design. Treatment 164 149 142 157 167 124 145 149 149 137 169 136 156 142 144 141.6 119.6 126 122 133 141 152 130 134 Sample mean Sample variance a. Compute the sum of squares between treatments. Round the intermediate calculations to whole number 1488 b. Compute the mean squ are between treatments. 744 c. Compute the sum of squares due to error. 135.33 d. Compute the mean square due to...
Consider the following time series data: Month Value 1 1 25 2 12 3 20 4...
 Consider the following time series data: Month Value 1 1 25 2 12 3 20 4 12 5 18 6 23 7 15 (a) Compute MSE using the most recent value as the forecast for the next period. If required, round your answer to one decimal place. 70.3 What is the forecast for month 8? If required, round your answer to one decimal place. Do not round intermediate calculation. 1 (b) Compute MSE using the average of all the data...
Given the series of demand data below Period: 1 2 3 4 5 6 7 8...
Given the series of demand data below Period: 1 2 3 4 5 6 7 8 9 10 Demand: 41 31 51 45 23 48 33 43 29 38 a. Calculate the forecasts for periods 7 through 11 using moving average models with n = 2, n = 4, and n = 6. (Round your intermediate calculations and final answers to 1 decimal place.) b-1. Calculate the bias and MAD for each set of forecasts. (Negative answers should be...
 Serum Systolic Serum Systolic Serum Systolic Serum Systolic Serum Systolic 04 137 183115 218 145 209 170 195 115 Question 1a: Data a. Use the proportion from question 1a. Test the claim that the Sample 153 127 193 146 173 194 163 201...-174--157 proportion of Asianssi-s than 25%, use 219 ; 1191 163 160 174,160 140 Proportion 0.2 Critical Value 1.645 Margin of Error 0.0658 144 140 145 177 152166175 200 131 Hypotheses: You may write HO and Hl Test...
 An analyst must decide between two different forecasting techniques for weekly sales of roller blades: a linear trend equation and the naive approach. The linear trend equation is Ft = 124 + 2.1t, and it was developed using data from periods 1 through 10. Based on data for periods 11 through 20 as shown in the table, which of these two methods has the greater accuracy if MAD and MSE are used? (Round your intermediate calculations and final answers to...
 Consider the following Time Series.
Consider the following time series. eri Demand 66 6 9 13 14 1 13 a) Using a trend projection, forecast the demand for Period 9. b) Calculate the MAD for this forecast.
Consider the following time series. eri Demand 66 6 9 13 14 1 13 a) Using a trend projection, forecast the demand for Period 9. b) Calculate the MAD for this forecast.
Consider the following Time Series.
Consider the following time series. eri Demand 66 6 9 13 14 1 13 a) Using a trend projection, forecast the demand for Period 9. b) Calculate the MAD for this forecast.
Consider the following time series. eri Demand 66 6 9 13 14 1 13 a) Using a trend projection, forecast the demand for Period 9. b) Calculate the MAD for this forecast.
 The following data are from a completely randomized design. Treatment 164 149 142 157 167 124 145 149 149 137 169 136 156 142 144 141.6 119.6 126 122 133 141 152 130 134 Sample mean Sample variance a. Compute the sum of squares between treatments. Round the intermediate calculations to whole number 1488 b. Compute the mean squ are between treatments. 744 c. Compute the sum of squares due to error. 135.33 d. Compute the mean square due to...
 Consider the following time series data: Month Value 1 1 25 2 12 3 20 4 12 5 18 6 23 7 15 (a) Compute MSE using the most recent value as the forecast for the next period. If required, round your answer to one decimal place. 70.3 What is the forecast for month 8? If required, round your answer to one decimal place. Do not round intermediate calculation. 1 (b) Compute MSE using the average of all the data...
Most questions answered within 3 hours.
-
Where is the error in this code sequence?
String s1 = "Hello";
String s2 = "ello";...
asked 11 months ago -
Financial data for Joel de Paris, Inc., for last year
follow:
Joel de Paris, Inc.
Balance...
asked 11 months ago -
Consider this reaction:
Al2(SO4)3 (aq)+ BaCl3
(aq) Al2Cl6 (aq)- +
3BaSO4(s) . What is the...
asked 11 months ago -
Suppose that Savneet is considering increasing her
recent random sample from 20 car rentals to 40...
asked 11 months ago -
Trucks arrive at an unloading terminal at an average rate of 120
per hour.
Trucks arrive...
asked 11 months ago -
Why are methanol and ethanol completely soluble in water while
octanol is not very little soluble....
asked 11 months ago -
A facilities manager at a university reads in a research report
that the mean amount of...
asked 11 months ago -
When the CuSO4 is rehydrated by adding water to the anhydrous
compound, is this an endothermic...
asked 11 months ago -
A ray of sunlight is passing from diamond into crown glass; the
angle of incidence is...
asked 11 months ago -
A block of mass 0.249 kg is placed on top of a light, vertical
spring of...
asked 11 months ago -
how do the kidneys compensate in the presences of acidosis
a) trigger hyperventilate
b) reserve acid...
asked 11 months ago -
Question 501 pts
The rental rate of capital to the firm increases. Which of the
following...
asked 11 months ago