
Homework Answers
Solution


Conclusion : We have enough evidence to claim that association exists between response and major-Response and Major are dependent.
Add Answer to:
Perform a chi-square independence test using the critical value approach, provided the conditions for using the...
this is the table given Perform a chi-square independence test using the critical value approach, provided...
 this is the table
given
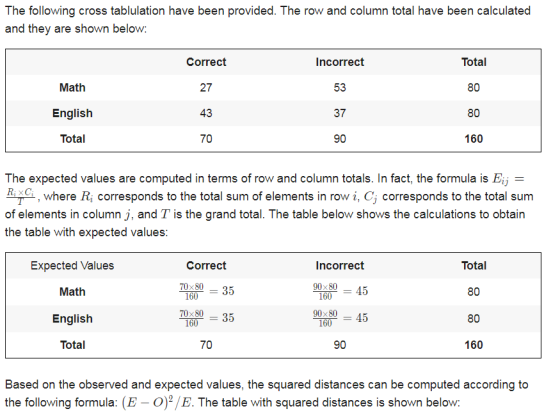
Perform a chi-square independence test using the critical value approach, provided the conditions for using the test are met. Be sure to state the hypotheses and the significance level, to obtain the expected frequencies, to obtain the critical value, to compute the value of the test statistic, and to state your conclusion. 160 students who were majoring in either math or English were asked a test question, and the researcher recorded whether they answered the...
this is the table
given
Perform a chi-square independence test using the critical value approach, provided the conditions for using the test are met. Be sure to state the hypotheses and the significance level, to obtain the expected frequencies, to obtain the critical value, to compute the value of the test statistic, and to state your conclusion. 160 students who were majoring in either math or English were asked a test question, and the researcher recorded whether they answered the...
Perform a chi-square independence test using either p-value or critical value approach, provided the conditions for...
Perform a chi-square independence test using either p-value or critical value approach, provided the conditions for using the test are met. Be sure to state the hypotheses and the significance level, to obtain the expected frequencies, to obtain the critical value, to compute the value of the test statistic, and to state your conclusion. 4) The table below shows the age and favorite type of music of 668 randomly selected people. Rock Jazz Classical 15-25 50 85 73 25-35 68...
A researcher computes a 2 x 3 chi-square test for independence. What is the critical value...
A researcher computes a 2 x 3 chi-square test for independence. What is the critical value for this test at a.05 level of significance?
Use a χ2 test to test the claim that in the given contingency table, the row variable and the column variable are indepe...
 Use a χ2 test to
test the claim that in the given contingency table, the row
variable and the column variable are independent.
160 students who were majoring in either math or English were asked
a test question, and the researcher recorded whether they answered
the question correctly. The sample results are given below. At the
0.10 significance level, test the claim that response and major are
independent.
a. test statistic
b. critical value
Use a χ2 test to
test the claim that in the given contingency table, the row
variable and the column variable are independent.
160 students who were majoring in either math or English were asked
a test question, and the researcher recorded whether they answered
the question correctly. The sample results are given below. At the
0.10 significance level, test the claim that response and major are
independent.
a. test statistic
b. critical value
To perform a chi-square test of independence for this contingency table at the 196 significance level, what is the critical value of chisquare?
You observe 100 randomly selected college students to find out whether they arrive on time or late for their classes. The table below gives a two-way classification for these students.GenderOn TimeLateFemale359Male4313To perform a chi-square test of independence for this contingency table at the 196 significance level, what is the critical value of chisquare?7.8796.63510.5979.210
120 students who were majoring in math or english were asked a test question, and the...
120 students who were majoring in math or english were asked a test question, and the researcher recorded wheter they answered the question correctly. the sample results are given below. at the 0.05 significance level, test the claim that response and major are independent. correct incorrect math 24 46 english 35 15 what is a. claim, b. test statistics, c. critical values d comparison between test statistics and critical value, and e. conclusion.
Chi-Square Test for Independence Using Chi-Square, we are looking to see if there is a significant...
Chi-Square Test for Independence Using Chi-Square, we are looking to see if there is a significant difference between what we would expect results to be, and what the actual results were. That is, expected vs. observed. Use alpha = .05 Listed below are data from a survey conducted recently where Males and Females responded to their happiness with their supervisor (this is fictitious data). Response Male Female Total Not at all 23 25 48 Somewhat 13 22 35 Very 26 16 42...
Part1. Chi-Square Test of Independence. Given the following contingency table, conduct a Chi-square test of independence....
Part1. Chi-Square Test of Independence. Given the following contingency table, conduct a Chi-square test of independence. What is the overall count (i.e. sample size)? Category 1 Category 2 1 2 3 4 1 120 112 100 110 2 127 115 120 124 3 118 115 110 124 442 365 1,396 358 2,790 None of the above Part 2. Chi-Square Test of Independence. What is the total for column 4? 442 365 1,396 358 None of the above Part 3....
What is the critical value for a chi-square test with 28 degrees of freedom at the...
What is the critical value for a chi-square test with 28 degrees of freedom at the 5 percent level of significance (3 pts)? If the chi-square test statistic were 41.10, what would you conclude regarding the null hypothesis (4 pts)? What would you conclude if the chi-square value were 48.19
Does the data meet the conditions for the chi-square test? StatCrunch Instructions: Test of Independence Using...
 Does the data meet the conditions for the chi-square test?
StatCrunch Instructions: Test of Independence Using
Technology
Next we will use StatCrunch to calculate the expected
counts:
Enter Yes and No in column var1.
Enter the observed counts as they appear in the table above
(not including the totals) into columns var2 and var3.
Rename: var1 as "911", var2 as "No Risk" and var3 as "M to S
Risk"
Choose Stat -> Tables -> Contingency -> with
summary
Select the...
Does the data meet the conditions for the chi-square test?
StatCrunch Instructions: Test of Independence Using
Technology
Next we will use StatCrunch to calculate the expected
counts:
Enter Yes and No in column var1.
Enter the observed counts as they appear in the table above
(not including the totals) into columns var2 and var3.
Rename: var1 as "911", var2 as "No Risk" and var3 as "M to S
Risk"
Choose Stat -> Tables -> Contingency -> with
summary
Select the...
 this is the table
given
Perform a chi-square independence test using the critical value approach, provided the conditions for using the test are met. Be sure to state the hypotheses and the significance level, to obtain the expected frequencies, to obtain the critical value, to compute the value of the test statistic, and to state your conclusion. 160 students who were majoring in either math or English were asked a test question, and the researcher recorded whether they answered the...
this is the table
given
Perform a chi-square independence test using the critical value approach, provided the conditions for using the test are met. Be sure to state the hypotheses and the significance level, to obtain the expected frequencies, to obtain the critical value, to compute the value of the test statistic, and to state your conclusion. 160 students who were majoring in either math or English were asked a test question, and the researcher recorded whether they answered the...
 Use a χ2 test to
test the claim that in the given contingency table, the row
variable and the column variable are independent.
160 students who were majoring in either math or English were asked
a test question, and the researcher recorded whether they answered
the question correctly. The sample results are given below. At the
0.10 significance level, test the claim that response and major are
independent.
a. test statistic
b. critical value
Use a χ2 test to
test the claim that in the given contingency table, the row
variable and the column variable are independent.
160 students who were majoring in either math or English were asked
a test question, and the researcher recorded whether they answered
the question correctly. The sample results are given below. At the
0.10 significance level, test the claim that response and major are
independent.
a. test statistic
b. critical value
 Does the data meet the conditions for the chi-square test?
StatCrunch Instructions: Test of Independence Using
Technology
Next we will use StatCrunch to calculate the expected
counts:
Enter Yes and No in column var1.
Enter the observed counts as they appear in the table above
(not including the totals) into columns var2 and var3.
Rename: var1 as "911", var2 as "No Risk" and var3 as "M to S
Risk"
Choose Stat -> Tables -> Contingency -> with
summary
Select the...
Does the data meet the conditions for the chi-square test?
StatCrunch Instructions: Test of Independence Using
Technology
Next we will use StatCrunch to calculate the expected
counts:
Enter Yes and No in column var1.
Enter the observed counts as they appear in the table above
(not including the totals) into columns var2 and var3.
Rename: var1 as "911", var2 as "No Risk" and var3 as "M to S
Risk"
Choose Stat -> Tables -> Contingency -> with
summary
Select the...
Most questions answered within 3 hours.
-
Where is the error in this code sequence?
String s1 = "Hello";
String s2 = "ello";...
asked 10 months ago -
Financial data for Joel de Paris, Inc., for last year
follow:
Joel de Paris, Inc.
Balance...
asked 10 months ago -
Consider this reaction:
Al2(SO4)3 (aq)+ BaCl3
(aq) Al2Cl6 (aq)- +
3BaSO4(s) . What is the...
asked 10 months ago -
Suppose that Savneet is considering increasing her
recent random sample from 20 car rentals to 40...
asked 10 months ago -
Trucks arrive at an unloading terminal at an average rate of 120
per hour.
Trucks arrive...
asked 10 months ago -
Why are methanol and ethanol completely soluble in water while
octanol is not very little soluble....
asked 10 months ago -
A facilities manager at a university reads in a research report
that the mean amount of...
asked 10 months ago -
When the CuSO4 is rehydrated by adding water to the anhydrous
compound, is this an endothermic...
asked 10 months ago -
A ray of sunlight is passing from diamond into crown glass; the
angle of incidence is...
asked 10 months ago -
A block of mass 0.249 kg is placed on top of a light, vertical
spring of...
asked 10 months ago -
how do the kidneys compensate in the presences of acidosis
a) trigger hyperventilate
b) reserve acid...
asked 10 months ago -
Question 501 pts
The rental rate of capital to the firm increases. Which of the
following...
asked 10 months ago