Scenario: 100 people were asked, “Who is your favorite superhero?” Below are the data. Test the...
Scenario: 100 people were asked, “Who is your favorite superhero?” Below are the data. Test the null hypothesis that the population frequencies for each category are equal. α= .05.
| Iron Man | Black Panther | Wonder Woman | Spiderman |
| fo = 20 | fo = 30 | fo =30 | fo = 20 |
| fe= | fe= | fe= | fe= |
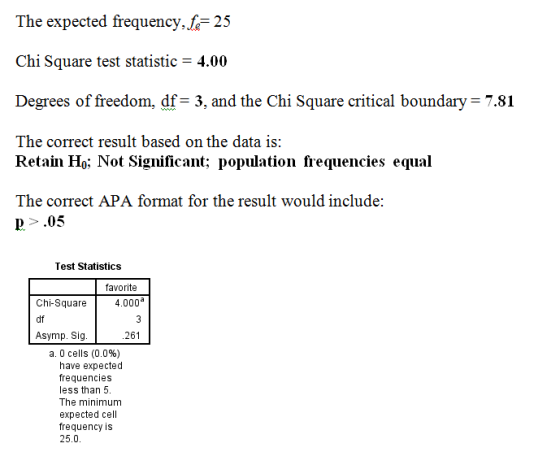
The expected frequency, fe= ____
4
25
20
100
Chi Square test statistic = ______
6.55
4.00
8.00
3.50
degrees of freedom, df = ______, and the Chi Square critical boundary = ______
1; 3.84
3; 7.81
2; 5.99
4; 9.49
What is the correct result based on the data?
Retain H0; Not Significant; population frequencies equal
Reject H0; Significant; population frequencies NOT equal
Reject H0; Significant; population frequencies equal
Retain H0; Not Significant; population frequencies NOT equal
The correct APA format for the result would include
p < .05
p > .05
Homework Answers
Add Answer to:
Scenario: 100 people were asked, “Who is your favorite
superhero?” Below are the data. Test the...
Scenario: 100 people were asked, "Who is your favorite superhero?" Below are the data. Test the...
 Scenario: 100 people were asked, "Who is your favorite superhero?" Below are the data. Test the null hypothesis that the population frequencies for each category are equal. a=.05. Iron Man Black Panther Wonder Woman Spiderman f. = 20 f. = 30 f. =30 fo = 20 fe fe fe = The expected frequency, fe = O 20 4 O O 100 25 [example continued...] Scenario: 100 people were asked, "Who is your favorite superhero?" Below are the data. Test the...
Scenario: I'm interested in whether there is a relationship between Team (A vs. B) and Outcome...
Scenario: I'm interested in whether there is a relationship between Team (A vs. B) and Outcome (Good vs. Bad). Below are the data. Test the null hypothesis that the categories are independent. α= .05. Team A Team B Good Outcome fo = 35 fe= fo = 55 fe= Bad Outcome fo = 15 fe= fo = 45 fe= The expected frequency, fe , for the Team A X Good Outcome category = _____ 20 90 30 40 The Chi Square...
5. Interpretation of a chi-square test for goodness of fit Suppose you are reading a study...
 5. Interpretation of a chi-square test for goodness of fit Suppose you are reading a study conducted in the year 2000 about welfare recipients in the United States. The study consisted of a random sample of 199 welfare recipients, and provides summary statistics about various demographic characteristics of the sample, indluding household size broken down into five categories (one, two, three, four, and five or more persons in the household). You wonder if welfare recipients tend to live in different-...
Using the accompanying data below, perform a chi-square test using alphaαequals=0.01 to determine if the proportion...
Using the accompanying data below, perform a chi-square test using alphaαequals=0.01 to determine if the proportion of "Yes" observations differs between Populations A and B. Observed frequencies: Population Yes No A 18 20 B 22 20 Expected frequencies: Population Yes No A 19 19 B 21 21 Click the icon to view an excerpt from the table of chi-square critical values. What are the null and alternative hypotheses? A. Upper H 0H0: p Subscript Upper A Baseline not equals p...
A distribution and the observed frequencies of the values of a variable from a simple random sample of the population are provided below. Use the chi-square goodness-of-fit test to decide, at the spe...
 A distribution and the observed frequencies of the values of a variable from a simple random sample of the population are provided below. Use the chi-square goodness-of-fit test to decide, at the specified significance level, whether the distribution of the variable differs from the given distribution Distribution: 0.1875, 0.1875, Observed frequencies: 16, 20, 24, 36 Significance level 0.05 0.3125, 0.3125 Determine the null and alternative hypotheses. Choose the correct answer below. OA. H: The distribution of the variable differs from...
 Scenario: 100 people were asked, "Who is your favorite superhero?" Below are the data. Test the null hypothesis that the population frequencies for each category are equal. a=.05. Iron Man Black Panther Wonder Woman Spiderman f. = 20 f. = 30 f. =30 fo = 20 fe fe fe = The expected frequency, fe = O 20 4 O O 100 25 [example continued...] Scenario: 100 people were asked, "Who is your favorite superhero?" Below are the data. Test the...
 5. Interpretation of a chi-square test for goodness of fit Suppose you are reading a study conducted in the year 2000 about welfare recipients in the United States. The study consisted of a random sample of 199 welfare recipients, and provides summary statistics about various demographic characteristics of the sample, indluding household size broken down into five categories (one, two, three, four, and five or more persons in the household). You wonder if welfare recipients tend to live in different-...
 A distribution and the observed frequencies of the values of a variable from a simple random sample of the population are provided below. Use the chi-square goodness-of-fit test to decide, at the specified significance level, whether the distribution of the variable differs from the given distribution Distribution: 0.1875, 0.1875, Observed frequencies: 16, 20, 24, 36 Significance level 0.05 0.3125, 0.3125 Determine the null and alternative hypotheses. Choose the correct answer below. OA. H: The distribution of the variable differs from...
Most questions answered within 3 hours.
-
Where is the error in this code sequence?
String s1 = "Hello";
String s2 = "ello";...
asked 11 months ago -
Financial data for Joel de Paris, Inc., for last year
follow:
Joel de Paris, Inc.
Balance...
asked 11 months ago -
Consider this reaction:
Al2(SO4)3 (aq)+ BaCl3
(aq) Al2Cl6 (aq)- +
3BaSO4(s) . What is the...
asked 11 months ago -
Suppose that Savneet is considering increasing her
recent random sample from 20 car rentals to 40...
asked 11 months ago -
Trucks arrive at an unloading terminal at an average rate of 120
per hour.
Trucks arrive...
asked 11 months ago -
Why are methanol and ethanol completely soluble in water while
octanol is not very little soluble....
asked 11 months ago -
A facilities manager at a university reads in a research report
that the mean amount of...
asked 11 months ago -
When the CuSO4 is rehydrated by adding water to the anhydrous
compound, is this an endothermic...
asked 11 months ago -
A ray of sunlight is passing from diamond into crown glass; the
angle of incidence is...
asked 11 months ago -
A block of mass 0.249 kg is placed on top of a light, vertical
spring of...
asked 11 months ago -
how do the kidneys compensate in the presences of acidosis
a) trigger hyperventilate
b) reserve acid...
asked 11 months ago -
Question 501 pts
The rental rate of capital to the firm increases. Which of the
following...
asked 11 months ago