
Homework Answers
X: Time and Y: Money
a) Correlation coefficient
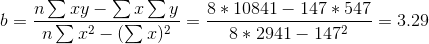
The formula for correlation coefficient(r)
![r = \frac{n\sum xy-\sum x\sum y}{\sqrt{[n\sum x^2-(\sum x)^2][n\sum y^2-(\sum y)^2]}}](http://img.homeworklib.com/questions/96648f30-f05a-11ea-ac98-5d20f4728e45.png?x-oss-process=image/resize,w_560)
where n = number of pairs = 8

![r=\frac{8*10841-(147*547)}{\sqrt{[8*2941-147^2][8*41145-547^2]}} = 0.83](http://img.homeworklib.com/questions/97271040-f05a-11ea-b100-4dacb1420adf.png?x-oss-process=image/resize,w_560)
Correlation coefficient, r = 0.83
b) The null and alternative hypothesis for correlation

The t test sttaistics for the test is,
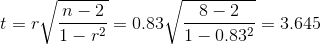
Degrees of freedom = n - 2 = 6 and the test is two-tailed test.
P-value using the excel function is
=tdist(test statistics, df, tail of test) = tdist(3.645,6,2) = 0.0108
P-value = 0.0108
c) alpha = 0.05 and p-value = 0.0108
If P-value > alpha thne fail to reject the null otherwise reject the null hypothesis.
Here p-value is not more than alpha so reject the null hypothesis that is there is correlation between both variables thus the regression line is useful for prediction.
Last option is correct.
d) r2
Square of r is nothing but r^2
 that is 0.69
r2 = 69%
e) Interpretation of r2
Option second is correct for interpretation.
f) Equation of linear regression line

where a is intercept and b is slope
The formula of slope is
The formula of intercept is

The equation of line is

g) Predict amount of money spent.
x = 14 minutes

Approximately 54 dollars
Dollar spent = 54
Add Answer to:
Grades People Office 365 My Media Media Gallery A grocery store manager did a study to...
A grocery store manager did a study to look at the relationship between the amount of...
 A grocery store manager did a study to look at the relationship between the amount of time (in minutes) customers spend in the store and the amount of money in dollars) they spend. The results of the survey are shown below. Time Money 12 49 24 115 6 23 28 100 6 25 14 46 15 76 a. Find the correlation coefficient: r = Round to 2 decimal places. b. The null and alternative hypotheses for correlation are: H: ?...
A grocery store manager did a study to look at the relationship between the amount of...
A grocery store manager did a study to look at the relationship between the amount of time (in minutes) customers spend in the store and the amount of money (in dollars) they spend. The results of the survey are shown below. Time 18 24 9 32 12 17 22 28 15 21 19 Money 31 30 26 79 24 37 45 88 22 35 25 A. r = [ Select ] 0.19", "0.81", "0.37", "0.92"] Round to three...
What is the relationship between the amount of time statistics students study per week and their...
 What is the relationship between the amount of time statistics students study per week and their final exam scores? The results of the survey are shown below. Time Score 3 10 15 512 015 58 75 89 89 77 79 54 96 a. Find the correlation coefficient: r = Round to 2 decimal places. b. The null and alternative hypotheses for correlation are: Ho: ? - 0 H: 70 (Round to four The p-value is: decimal places) c. Use a...
What is the relationship between the number of minutes per day a woman spends talking on...
 What is the relationship between the number of minutes per day a woman spends talking on the phone and the woman's weight? The time on the phone and weight for 9 women are shown in the table below. 28 15 Time Pounds 68 149 22 100 64 124 57 143 67 141 101 77 126 68 127 100 0 a. Find the correlation coefficient: r = Round to 2 decimal places. b. The null and alternative hypotheses for correlation are:...
What is the relationship between the amount of time statistics students study per week and their...
 What is the relationship between the amount of time statistics students study per week and their final exam scores? The results of the survey are shown below. Time Score 3 67 13 95 6 15 77 89 13 100 3 66 7 63 11 79 1 59 a. Find the correlation coefficient: r = Round to 2 decimal places. b. The null and alternative hypotheses for correlation are: Ho: ? D = 0 H: ? *0 The p-value is: (Round...
please correct red error boxes What is the relationship between the amount of time statistics students...
 please correct red error boxes
What is the relationship between the amount of time statistics students study per week and their final exam scores! The results of the survey are shown below The ruil and alternative hypotheses for correlation are The preluet: 1.0024 Round to four decimal places c. Use a level of sigrice -0.05 to state the conclusion of the hypothesis test in the context of There la statistically significant evidence la conclude that there a carrodation between the...
please correct red error boxes
What is the relationship between the amount of time statistics students study per week and their final exam scores! The results of the survey are shown below The ruil and alternative hypotheses for correlation are The preluet: 1.0024 Round to four decimal places c. Use a level of sigrice -0.05 to state the conclusion of the hypothesis test in the context of There la statistically significant evidence la conclude that there a carrodation between the...
What is the relationship between the amount of time statistics students study per week and their...
What is the relationship between the amount of time statistics students study per week and their final exam scores? The results of the survey are shown below. Time 12 0 3 14 14 9 0 13 10 Score 95 60 73 85 86 89 65 97 93 Find the correlation coefficient: r=r= Round to 2 decimal places. The null and alternative hypotheses for correlation are: H0:H0: ? μ ρ r == 0 H1:H1: ? ρ μ r ≠≠ 0 The p-value is: (Round...
(28 pts) A grocery store manager did a study to look at the relationship between the...
(28 pts) A grocery store manager did a study to look at the relationship between the amount of time (in minutes) customers spend in the store and the amount of money (in dollars) they spend. The results of the survey are shown below. Time: 18 24 9 32 12 17 22 28 15 21 19 Money: 31 30 26 79 24 37 45 88 22 35 25 (4 pts) What is the value of the correlation coefficient? (12 pts) Test...
What is the relationship between the amount of time statistics students study per week and their...
What is the relationship between the amount of time statistics students study per week and their test scores? The results of the survey are shown below. Time 16 14 15 6 14 15 6 Score 100 89 100 68 99 100 78 x-values y-values Find the correlation coefficient: r=r= Round to 2 decimal places. The null and alternative hypotheses for correlation are: H0:H0: ? ρ r μ == 0 H1:H1: ? μ r ρ ≠≠ 0 The p-value is: (Round to four decimal...
study was done to look at the relationship between number of movies people watch at the...
 study was done to look at the relationship between number of movies people watch at the theater each year and the number of books that they read each year. The results of the survey are shown below. 26 Movics 4 9 4 0 1 3 Books 12 1 2 13 a. Find the correlation coefficient: r = Round to 2 decimal places. b. The null and alternative hypotheses for correlation are: Ho ? 0 H1? 0 Round to 4 decimal...
 A grocery store manager did a study to look at the relationship between the amount of time (in minutes) customers spend in the store and the amount of money in dollars) they spend. The results of the survey are shown below. Time Money 12 49 24 115 6 23 28 100 6 25 14 46 15 76 a. Find the correlation coefficient: r = Round to 2 decimal places. b. The null and alternative hypotheses for correlation are: H: ?...
 What is the relationship between the amount of time statistics students study per week and their final exam scores? The results of the survey are shown below. Time Score 3 10 15 512 015 58 75 89 89 77 79 54 96 a. Find the correlation coefficient: r = Round to 2 decimal places. b. The null and alternative hypotheses for correlation are: Ho: ? - 0 H: 70 (Round to four The p-value is: decimal places) c. Use a...
 What is the relationship between the number of minutes per day a woman spends talking on the phone and the woman's weight? The time on the phone and weight for 9 women are shown in the table below. 28 15 Time Pounds 68 149 22 100 64 124 57 143 67 141 101 77 126 68 127 100 0 a. Find the correlation coefficient: r = Round to 2 decimal places. b. The null and alternative hypotheses for correlation are:...
 What is the relationship between the amount of time statistics students study per week and their final exam scores? The results of the survey are shown below. Time Score 3 67 13 95 6 15 77 89 13 100 3 66 7 63 11 79 1 59 a. Find the correlation coefficient: r = Round to 2 decimal places. b. The null and alternative hypotheses for correlation are: Ho: ? D = 0 H: ? *0 The p-value is: (Round...
 please correct red error boxes
What is the relationship between the amount of time statistics students study per week and their final exam scores! The results of the survey are shown below The ruil and alternative hypotheses for correlation are The preluet: 1.0024 Round to four decimal places c. Use a level of sigrice -0.05 to state the conclusion of the hypothesis test in the context of There la statistically significant evidence la conclude that there a carrodation between the...
please correct red error boxes
What is the relationship between the amount of time statistics students study per week and their final exam scores! The results of the survey are shown below The ruil and alternative hypotheses for correlation are The preluet: 1.0024 Round to four decimal places c. Use a level of sigrice -0.05 to state the conclusion of the hypothesis test in the context of There la statistically significant evidence la conclude that there a carrodation between the...
 study was done to look at the relationship between number of movies people watch at the theater each year and the number of books that they read each year. The results of the survey are shown below. 26 Movics 4 9 4 0 1 3 Books 12 1 2 13 a. Find the correlation coefficient: r = Round to 2 decimal places. b. The null and alternative hypotheses for correlation are: Ho ? 0 H1? 0 Round to 4 decimal...
Most questions answered within 3 hours.
-
Where is the error in this code sequence?
String s1 = "Hello";
String s2 = "ello";...
asked 11 months ago -
Financial data for Joel de Paris, Inc., for last year
follow:
Joel de Paris, Inc.
Balance...
asked 11 months ago -
Consider this reaction:
Al2(SO4)3 (aq)+ BaCl3
(aq) Al2Cl6 (aq)- +
3BaSO4(s) . What is the...
asked 11 months ago -
Suppose that Savneet is considering increasing her
recent random sample from 20 car rentals to 40...
asked 11 months ago -
Trucks arrive at an unloading terminal at an average rate of 120
per hour.
Trucks arrive...
asked 11 months ago -
Why are methanol and ethanol completely soluble in water while
octanol is not very little soluble....
asked 11 months ago -
A facilities manager at a university reads in a research report
that the mean amount of...
asked 11 months ago -
When the CuSO4 is rehydrated by adding water to the anhydrous
compound, is this an endothermic...
asked 11 months ago -
A ray of sunlight is passing from diamond into crown glass; the
angle of incidence is...
asked 11 months ago -
A block of mass 0.249 kg is placed on top of a light, vertical
spring of...
asked 11 months ago -
how do the kidneys compensate in the presences of acidosis
a) trigger hyperventilate
b) reserve acid...
asked 11 months ago -
Question 501 pts
The rental rate of capital to the firm increases. Which of the
following...
asked 11 months ago