
Homework Answers

Add Answer to:
2. Suppose that we are using a box-and-whisker plot to depict a population or sample of...
ownloads/nun.por 2. Suppose that we are using a box-and-whisker plot to depict a population or sample...
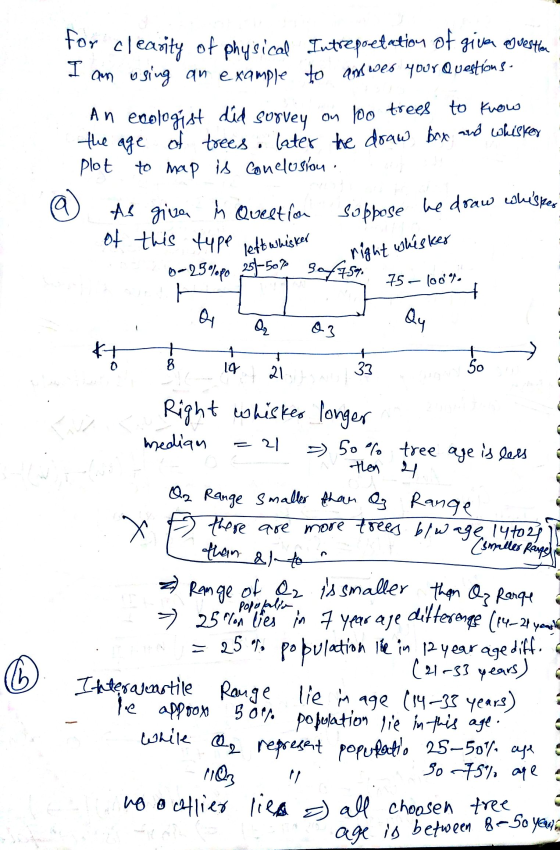
 ownloads/nun.por 2. Suppose that we are using a box-and-whisker plot to depict a population or sample of measurements. How would you interpret each of the following. (a) The whisker to the right is much longer than the whisker to the left. [2 marks] (b) The interquartile range is much longer than either of the whiskers and there are no outliers. [2 marks] (c) The distance between Q. and the median is far less than the difference betwen the median and...
Consider the following box-and- whisker plot. +++ HH 50 52 54 56 58 Determine the following...
 Consider the following box-and- whisker plot. +++ HH 50 52 54 56 58 Determine the following values. Please type your solution in the text entry boxes provided. a. The value of the minimum is - (Use the form XX) b. The value of the first quartile is - (Use the form c. The value of the second quartile is (Use the form XX) d. The value of the third quartile is - (Use the form XX) e. The value of...
Consider the following box-and- whisker plot. Htt 34 36 38 40 42 44 46 48 50...
 Consider the following box-and- whisker plot. Htt 34 36 38 40 42 44 46 48 50 52 54 56 58 Determine the following values. Please type your solution in the text entry boxes provided. e. The value of the maximum is - (Use the form XX) f. The value of the median is - (Use the form XX) g. The value of the range is - (Use the form XX) h. The value of the interquartile range is - (Use...
Use the side-by-side boxplots shown to complete parts (a) through (e). Q X у 30 90...
 Use the side-by-side boxplots shown to complete parts (a) through (e). Q X у 30 90 (a) What is the median of variable x? The median of variable xis (Round to the nearest integer as needed.) (b) What is the third quartile of variable ? The third quartile of variable y s . (Round to the nearest integer as needed.) (c) Which variable has more dispersion? Why? O A. Variable y—the range of variable x is smaller than that of...
1)The range is a) the difference between the inner fences. b) the H-spread. c) not influenced...
1)The range is a) the difference between the inner fences. b) the H-spread. c) not influenced very much by outliers. d) the difference between the highest and lowest score. e) an obscure, large appliance in the kitchen useful only for storage 2)If the whiskers on a boxplot are much longer on the right than on the left, we would suspect that the distribution is a) positively skewed. b) negatively skewed. c) symmetric. d) distorted. 3)Data points that lie outside the...
6). a.b. The accompanying data represent the miles per gallon of a random sample of cars...
 6).
a.b.
The accompanying data represent the miles per gallon of a random sample of cars with a three-cylinder, 1.0 liter engine. (a) Compute the z-score corresponding to the individual who obtained 43.7 miles per gallon. Interpret this result. (b) Determine the quartiles. (c) Compute and interpret the interquartile range, IQR. (d) Determine the lower and upper fences. Are there any outliers? E Click the icon to view the data. (a) Compute the z-score corresponding to the individual who obtained...
6).
a.b.
The accompanying data represent the miles per gallon of a random sample of cars with a three-cylinder, 1.0 liter engine. (a) Compute the z-score corresponding to the individual who obtained 43.7 miles per gallon. Interpret this result. (b) Determine the quartiles. (c) Compute and interpret the interquartile range, IQR. (d) Determine the lower and upper fences. Are there any outliers? E Click the icon to view the data. (a) Compute the z-score corresponding to the individual who obtained...
2. Comparing smaller data sets using box plots Two data sets describing the fraction of protein...
 2. Comparing smaller data sets using box plots Two data sets describing the fraction of protein recovered from thirteen test samples by each of two different methods are given in the table below Method1 Method 2 0.32 0.35 0.37 0.39 042 0.47 0.51 0.58 0.60 0.62 0.65 0.68 0.75 0.25 0.40 0.48 0.55 0.56 0.58 0.60 0.65 0.70 0.76 0.80 0.91 0.99 (a) Construct boxplots of the two sets of data. Compare the whisker lengths in the box plots of...
IB math studies please i need help!! Review Set 2 random sample of 200 females measured the length of their hair in cm. The results are displayed in the cumulative frequency curve below. 2. A 200...
 IB math studies
please i need help!!
Review Set 2 random sample of 200 females measured the length of their hair in cm. The results are displayed in the cumulative frequency curve below. 2. A 200 175 150 125 100 75 50 25 0 5 10 15 20 25 30 35 40 45 50 length (em) Write down the median length of hair in the sample. (a) (b) Find the interquartile range for the length of hair in the sample....
IB math studies
please i need help!!
Review Set 2 random sample of 200 females measured the length of their hair in cm. The results are displayed in the cumulative frequency curve below. 2. A 200 175 150 125 100 75 50 25 0 5 10 15 20 25 30 35 40 45 50 length (em) Write down the median length of hair in the sample. (a) (b) Find the interquartile range for the length of hair in the sample....
a. Obtain and interpret the quartiles.
a. Obtain and interpret the quartiles.Determine the quartiles.Upper Q 1Q1equals=nothingUpper Q 2Q2equals=nothingUpper Q 3Q3equals=nothing(Type integers or decimals. Do not round.)Interpret the quartiles. Choose the correct answer below.A.The quartiles suggest that all of the sharks bear a number of pups betweenUpper Q 1Q1andUpper Q 3Q3.B.The quartiles suggest that 25% of the sharks bear a number of pups less thanUpper Q 1Q1,25% bear a number of pups betweenUpper Q 1Q1andUpper Q 2Q2,25% bear a number of pups betweenUpper Q 2Q2andUpper Q 3Q3,and...
1. In a random sample, ten students were asked to compute the distance they travel one...
 1. In a random sample, ten students were asked to compute the distance they travel one way to school to the nearest tenth of a mile. The data is listed below. 1.1 1.8 5.2 2.2 Distance Traveled 3.6 5.0 5.2 1.5 4.8 0.8 Round all solutions one decimal places. You must show ALL of your work to receive credit for these problems. You may only use technology (graphing calculator/StatCrunch) to verify your solutions. g) Find quartile one, Q,, of the...
 ownloads/nun.por 2. Suppose that we are using a box-and-whisker plot to depict a population or sample of measurements. How would you interpret each of the following. (a) The whisker to the right is much longer than the whisker to the left. [2 marks] (b) The interquartile range is much longer than either of the whiskers and there are no outliers. [2 marks] (c) The distance between Q. and the median is far less than the difference betwen the median and...
 Consider the following box-and- whisker plot. +++ HH 50 52 54 56 58 Determine the following values. Please type your solution in the text entry boxes provided. a. The value of the minimum is - (Use the form XX) b. The value of the first quartile is - (Use the form c. The value of the second quartile is (Use the form XX) d. The value of the third quartile is - (Use the form XX) e. The value of...
 Consider the following box-and- whisker plot. Htt 34 36 38 40 42 44 46 48 50 52 54 56 58 Determine the following values. Please type your solution in the text entry boxes provided. e. The value of the maximum is - (Use the form XX) f. The value of the median is - (Use the form XX) g. The value of the range is - (Use the form XX) h. The value of the interquartile range is - (Use...
 Use the side-by-side boxplots shown to complete parts (a) through (e). Q X у 30 90 (a) What is the median of variable x? The median of variable xis (Round to the nearest integer as needed.) (b) What is the third quartile of variable ? The third quartile of variable y s . (Round to the nearest integer as needed.) (c) Which variable has more dispersion? Why? O A. Variable y—the range of variable x is smaller than that of...
 6).
a.b.
The accompanying data represent the miles per gallon of a random sample of cars with a three-cylinder, 1.0 liter engine. (a) Compute the z-score corresponding to the individual who obtained 43.7 miles per gallon. Interpret this result. (b) Determine the quartiles. (c) Compute and interpret the interquartile range, IQR. (d) Determine the lower and upper fences. Are there any outliers? E Click the icon to view the data. (a) Compute the z-score corresponding to the individual who obtained...
6).
a.b.
The accompanying data represent the miles per gallon of a random sample of cars with a three-cylinder, 1.0 liter engine. (a) Compute the z-score corresponding to the individual who obtained 43.7 miles per gallon. Interpret this result. (b) Determine the quartiles. (c) Compute and interpret the interquartile range, IQR. (d) Determine the lower and upper fences. Are there any outliers? E Click the icon to view the data. (a) Compute the z-score corresponding to the individual who obtained...
 2. Comparing smaller data sets using box plots Two data sets describing the fraction of protein recovered from thirteen test samples by each of two different methods are given in the table below Method1 Method 2 0.32 0.35 0.37 0.39 042 0.47 0.51 0.58 0.60 0.62 0.65 0.68 0.75 0.25 0.40 0.48 0.55 0.56 0.58 0.60 0.65 0.70 0.76 0.80 0.91 0.99 (a) Construct boxplots of the two sets of data. Compare the whisker lengths in the box plots of...
 IB math studies
please i need help!!
Review Set 2 random sample of 200 females measured the length of their hair in cm. The results are displayed in the cumulative frequency curve below. 2. A 200 175 150 125 100 75 50 25 0 5 10 15 20 25 30 35 40 45 50 length (em) Write down the median length of hair in the sample. (a) (b) Find the interquartile range for the length of hair in the sample....
IB math studies
please i need help!!
Review Set 2 random sample of 200 females measured the length of their hair in cm. The results are displayed in the cumulative frequency curve below. 2. A 200 175 150 125 100 75 50 25 0 5 10 15 20 25 30 35 40 45 50 length (em) Write down the median length of hair in the sample. (a) (b) Find the interquartile range for the length of hair in the sample....
 1. In a random sample, ten students were asked to compute the distance they travel one way to school to the nearest tenth of a mile. The data is listed below. 1.1 1.8 5.2 2.2 Distance Traveled 3.6 5.0 5.2 1.5 4.8 0.8 Round all solutions one decimal places. You must show ALL of your work to receive credit for these problems. You may only use technology (graphing calculator/StatCrunch) to verify your solutions. g) Find quartile one, Q,, of the...
Most questions answered within 3 hours.
-
Where is the error in this code sequence?
String s1 = "Hello";
String s2 = "ello";...
asked 10 months ago -
Financial data for Joel de Paris, Inc., for last year
follow:
Joel de Paris, Inc.
Balance...
asked 10 months ago -
Consider this reaction:
Al2(SO4)3 (aq)+ BaCl3
(aq) Al2Cl6 (aq)- +
3BaSO4(s) . What is the...
asked 10 months ago -
Suppose that Savneet is considering increasing her
recent random sample from 20 car rentals to 40...
asked 10 months ago -
Trucks arrive at an unloading terminal at an average rate of 120
per hour.
Trucks arrive...
asked 10 months ago -
Why are methanol and ethanol completely soluble in water while
octanol is not very little soluble....
asked 10 months ago -
A facilities manager at a university reads in a research report
that the mean amount of...
asked 10 months ago -
When the CuSO4 is rehydrated by adding water to the anhydrous
compound, is this an endothermic...
asked 10 months ago -
A ray of sunlight is passing from diamond into crown glass; the
angle of incidence is...
asked 10 months ago -
A block of mass 0.249 kg is placed on top of a light, vertical
spring of...
asked 10 months ago -
how do the kidneys compensate in the presences of acidosis
a) trigger hyperventilate
b) reserve acid...
asked 10 months ago -
Question 501 pts
The rental rate of capital to the firm increases. Which of the
following...
asked 10 months ago