The state education commission wants to estimate the fraction of tenth grade students that have reading...
The state education commission wants to estimate the fraction of tenth grade students that have reading skills at or below the eighth grade level.
Step 1 of 2:
Suppose a sample of 16491649 tenth graders is drawn. Of the students sampled, 379379 read at or below the eighth grade level. Using the data, estimate the proportion of tenth graders reading at or below the eighth grade level. Enter your answer as a fraction or a decimal number rounded to three decimal places.
The state education commission wants to estimate the fraction of tenth grade students that have reading skills at or below the eighth grade level.
Step 2 of 2:
Suppose a sample of 16491649 tenth graders is drawn. Of the students sampled, 379379 read at or below the eighth grade level. Using the data, construct the 95%95% confidence interval for the population proportion of tenth graders reading at or below the eighth grade level. Round your answers to three decimal places.
A researcher compares the effectiveness of two different instructional methods for teaching pharmacology. A sample of 4949 students using Method 1 produces a testing average of 72.872.8. A sample of 3131 students using Method 2 produces a testing average of 72.372.3. Assume that the population standard deviation for Method 1 is 6.296.29, while the population standard deviation for Method 2 is 15.715.7. Determine the 90%90% confidence interval for the true difference between testing averages for students using Method 1 and students using Method 2.
Step 1 of 3:
Find the point estimate for the true difference between the population means.
A researcher compares the effectiveness of two different instructional methods for teaching pharmacology. A sample of 4949 students using Method 1 produces a testing average of 72.872.8. A sample of 3131 students using Method 2 produces a testing average of 72.372.3. Assume that the population standard deviation for Method 1 is 6.296.29, while the population standard deviation for Method 2 is 15.715.7. Determine the 90%90% confidence interval for the true difference between testing averages for students using Method 1 and students using Method 2.
Step 2 of 3:
Calculate the margin of error of a confidence interval for the difference between the two population means. Round your answer to six decimal places.
A researcher compares the effectiveness of two different instructional methods for teaching pharmacology. A sample of 4949 students using Method 1 produces a testing average of 72.872.8. A sample of 3131 students using Method 2 produces a testing average of 72.372.3. Assume that the population standard deviation for Method 1 is 6.296.29, while the population standard deviation for Method 2 is 15.715.7. Determine the 90%90% confidence interval for the true difference between testing averages for students using Method 1 and students using Method 2.
Step 3 of 3:
Construct the 90%90% confidence interval. Round your answers to one decimal place.
Homework Answers
Solution:
Given
n= 1649 sample size of tenth grade students.
X = 379 students read at or below eight grade level.
 .
Level of significance .
.
Level of significance .
Step 1) To find the point estimate for the proportion of tenth grade readers reading at or below the eight grade level is

 .
Sample proportion of tenth grade readers reading at or below the
eight grade level.
.
Sample proportion of tenth grade readers reading at or below the
eight grade level.

Step 2) The 95% confidence interval for population proportion of tenth grade readers reading at or below the eight grade level is

At


(0.209697, 0.2503027)
( 0.210, 0.250)
The 95% confidence interval for population proportion of tenth grade readers reading at or below the eight grade level is ( 0.210, 0.250)
Given
n1= 49 sample size of method 1
n2= 31 sample size of method 2
 sample mean of method 1
 .
Sample mean of method 2
.
Sample mean of method 2
 .
Population standard deviations of method 1
.
Population standard deviations of method 1
 population standard deviations of method 2
 .
Level of significance.
.
Level of significance.
Step 1 ) To find the point estimate for the true difference between the population mean is


Point estimate = 0.5
Step 2) To find margin of error for the difference between two population means is
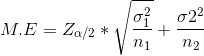
At
 .
From Z table
.
From Z table


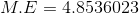
Margin of error =M.E= 4.853602
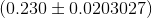
Step 3) The 90% confidence interval for the true difference
between testing average for students using method 1 and students
using method 2 that is  is
is


( -4.3536023, 5.3536023)
( -4.4, 5.4)
The 90% confidence interval for the true difference between testing average for students using method 1 and students using method 2 is
( -4.4, 5.4)
Add Answer to:
The state education commission wants to estimate the fraction of
tenth grade students that have reading...
The state education commission wants to estimate the fraction of tenth grade students that have reading...
The state education commission wants to estimate the fraction of tenth grade students that have reading skills at or below the eighth grade level. Step 2 of 2: Suppose a sample of 955 tenth graders is drawn. Of the students sampled, 143 read at or below the eighth grade level. Using the data, construct the 90% confidence interval for the population proportion of tenth graders reading at or below the eighth grade level. Round your answers to three decimal places.
The state education commission wants to estimate the fraction of tenth grade students that have reading...
The state education commission wants to estimate the fraction of tenth grade students that have reading skills at or below the eighth grade level. Step 2 of 2 : Suppose a sample of 549 tenth graders is drawn. Of the students sampled, 429 read above the eighth grade level. Using the data, construct the 90% confidence interval for the population proportion of tenth graders reading at or below the eighth grade level. Round your answers to three decimal places.
The state education commission wants to estimate the fraction of tenth grade students that have reading...
The state education commission wants to estimate the fraction of tenth grade students that have reading skills at or below the eighth grade level. Step 1 of 2: Suppose a sample of 2228 tenth graders is drawn. Of the students sampled, 311 read at or below the eighth grade level. Using the data, estimate the proportion of tenth graders reading at or below the eighth grade level. Enter your answer as a fraction or a decimal number rounded to three...
The state education commission wants to estimate the fraction of tenth grade students that have reading...
The state education commission wants to estimate the fraction of tenth grade students that have reading skills at or below the eighth grade level. Step 1 of 2 : Suppose a sample of 421 tenth graders is drawn. Of the students sampled, 329 read above the eighth grade level. Using the data, estimate the proportion of tenth graders reading at or below the eighth grade level. Enter your answer as a fraction or a decimal number rounded to three decimal...
The state education commission wants to estimate the fraction of tenth grade students that have reading...
The state education commission wants to estimate the fraction of tenth grade students that have reading skills at or below the eighth grade level. Step 1 of 2: Suppose a sample of 2004 tenth graders is drawn. Of the students sampled, 420 read at or below the eighth grade level. Using the data, estimate the proportion of tenth graders reading at or below the eighth grade level. Enter your answer as a fraction or a decimal number rounded to three...
The state education commission wants to estimate the fraction of tenth grade students that have reading...
The state education commission wants to estimate the fraction of tenth grade students that have reading skills at or below the eighth grade level. Step 2 of 2 : Suppose a sample of 830 tenth graders is drawn. Of the students sampled, 648 read above the eighth grade level. Using the data, construct the 85% confidence interval for the population proportion of tenth graders reading at or below the eighth grade level. Round your answers to three decimal places.
The state education commission wants to estimate the fraction of tenth grade students that have reading...
The state education commission wants to estimate the fraction of tenth grade students that have reading skills at or below the eighth grade level. Step 2 of 2 : Suppose a sample of 2404 tenth graders is drawn. Of the students sampled, 1803 read above the eighth grade level. Using the data, construct the 98% confidence interval for the population proportion of tenth graders reading at or below the eighth grade level. Round your answers to three decimal places.
The state education commission wants to estimate the fraction of tenth grade students that have reading...
The state education commission wants to estimate the fraction of tenth grade students that have reading skills at or below the eighth grade level. Step 2 of 2: Suppose a sample of 2089 tenth graders is drawn. Of the students sampled, 355 read at or below the eighth grade level. Using the data, construct the 98% confidence interval for the population proportion of tenth graders reading at or below the eighth grade level. Round your answers to three decimal places.
The state education commission wants to estimate the fraction of tenth grade students that have reading...
The state education commission wants to estimate the fraction of tenth grade students that have reading skills at or below the eighth grade level. Step 2 of 2 : Suppose a sample of 2172 tenth graders is drawn. Of the students sampled, 1673 read above the eighth grade level. Using the data, construct the 98% confidence interval for the population proportion of tenth graders reading at or below the eighth grade level. Round your answers to three decimal places.
The state education commission wants to estimate the fraction of tenth grade students that have reading...
The state education commission wants to estimate the fraction of tenth grade students that have reading skills at or below the eighth grade level. Step 2 of 2 : Suppose a sample of 323 tenth graders is drawn. Of the students sampled, 256 read above the eighth grade level. Using the data, construct the 80% confidence interval for the population proportion of tenth graders reading at or below the eighth grade level. Round your answers to three decimal places.
Most questions answered within 3 hours.
-
Where is the error in this code sequence?
String s1 = "Hello";
String s2 = "ello";...
asked 10 months ago -
Financial data for Joel de Paris, Inc., for last year
follow:
Joel de Paris, Inc.
Balance...
asked 10 months ago -
Consider this reaction:
Al2(SO4)3 (aq)+ BaCl3
(aq) Al2Cl6 (aq)- +
3BaSO4(s) . What is the...
asked 10 months ago -
Suppose that Savneet is considering increasing her
recent random sample from 20 car rentals to 40...
asked 10 months ago -
Trucks arrive at an unloading terminal at an average rate of 120
per hour.
Trucks arrive...
asked 10 months ago -
Why are methanol and ethanol completely soluble in water while
octanol is not very little soluble....
asked 10 months ago -
A facilities manager at a university reads in a research report
that the mean amount of...
asked 10 months ago -
When the CuSO4 is rehydrated by adding water to the anhydrous
compound, is this an endothermic...
asked 10 months ago -
A ray of sunlight is passing from diamond into crown glass; the
angle of incidence is...
asked 10 months ago -
A block of mass 0.249 kg is placed on top of a light, vertical
spring of...
asked 10 months ago -
how do the kidneys compensate in the presences of acidosis
a) trigger hyperventilate
b) reserve acid...
asked 10 months ago -
Question 501 pts
The rental rate of capital to the firm increases. Which of the
following...
asked 10 months ago